
INTERNATIONAL CIVIL AVIATION ORGANIZATION
ASIA-PACIFIC AIR TRAFFIC MANAGEMENT PERFORMANCE
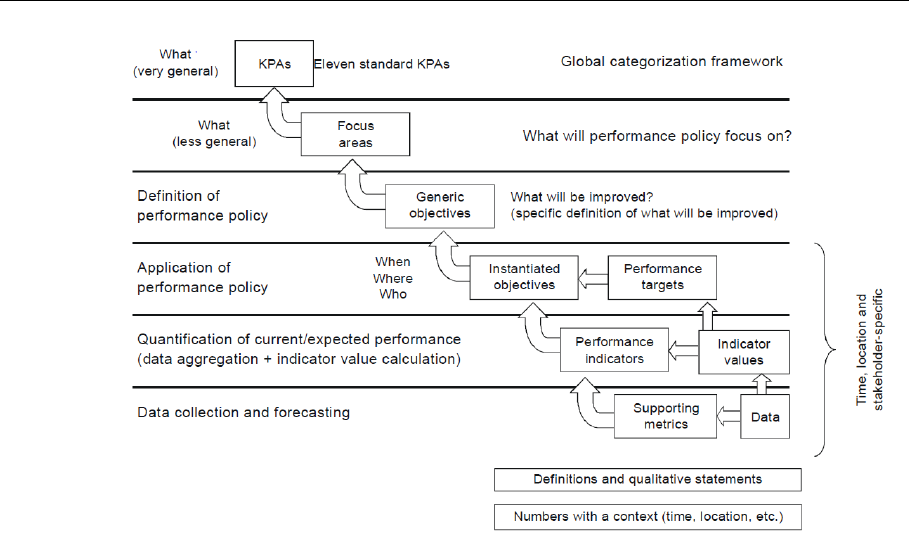
MEASUREMENT FRAMEWORK
Version 1.0, November 2019
This Framework was developed by the Regional ATM Performance
Measurement and Framework Small Working Group (RAPMF/SWG,
supported by NUAA of China), and was endorsed by the Seventh Meeting of
the Air Traffic Management Subgroup (ATM/SG/7) and approved by the
Thirtieth Meeting of the Asia Pacific Air Navigation Planning and
Implementation Regional Group (APANPIRG/30).
Approved by APANPIRG/30 and published by the
ICAO Asia and Pacific Office, Bangkok

Asia-Pacific Air Traffic Management Performance Measurement Framework V1.0
1
CONTENTS
BACKGROUND .................................................................................................................................... 1
FRAMEWORK COMPOSITION .......................................................................................................... 4
KPI FRAMEWORK – FIRST STAGE ................................................................................................ 12
KPI FRAMEWORK – SECOND STAGE ........................................................................................... 20
KPI FRAMEWORK – THIRD STAGE ............................................................................................... 26
KEY PERFORMANCE INDICATORS FOR SAFETY ...................................................................... 34
Step-By-Step Performance-Based Approach ........................................................................................ 38
Appendix A: ICAO and GANP Performance Indicators Frameworks ................................................. 52
Appendix 2: Filed Flight Plan En-Route Extension Rate/Actual En-Route Extension Rate ................ 54
Appendix 3: Abbreviations ................................................................................................................... 56

Asia-Pacific Air Traffic Management Performance Measurement Framework V1.0
1
BACKGROUND
Overview
1.1 With huge economic increase in Asia-Pacific region, air transportation has been
developing rapidly, which leads to a large raise of flights. Considering massive and high density of air
traffic is exposed to countries in Asia-Pacific region, some of the international flights may cross the
national border during the flight operation phase. Lack of unified management approach and evaluation
standard, many unexpected accidents have taken place.
1.2 ICAO data indicates that the Asia/Pacific Region in 2011 was the busiest in the world in
terms of Passenger Kilometres Performed (PKP): 1,496 billion compared to 1,434 for North America
and 1,385 for Europe, with growth rates of 8.0 - 8.8%, 2.3 - 3.5% and 4.2 - 4.8% over the 2012-2014
period respectively. In 2012, the Asia/Pacific region had the largest regional market share of total
domestic and international Revenue Passenger Kilometres (RPK) at 30%, compared to 27% for both
Europe and North America. Under the circumstances of those, in 2013, ICAO has published Asia-
Pacific Seamless ATM Plan, which provides a framework for a transition to a seamless ATM
environment, in order to meet future performance requirements. The objective of this plan is to facilitate
Asia-Pacific Seamless ATM operations, by developing and deploying ATM solutions capable of
ensuring safety and efficiency of air transport throughout the Asia-Pacific region. In the context of
globalization, this plan provides the opportunity for the Asia/Pacific region to adopt the benefits from
research and development conducted by various States including the NextGen (United States of
America), the European Single European Sky ATM Research (SESAR), and Japanese Collaborative
Actions for Renovation of Air Traffic Systems (CARATS).
1.3 This report is aimed at providing a systematic and scientific performance framework to
evaluate the operation performance which is subject to Key Performance Area of air transport system
in Asia-Pacific region. The performance oriented and data based approach is according to Doc 9883
Manual on Global Performance of the Air Navigation System to select the Key Performance Indicators,
which has been considered about the operation features and the availability of data of Asia-Pacific
region. To achieve the goals of Seamless ATM operations, the most widely accepted KPAs such as
safety, capacity, efficiency, predictability, environment and cost-efficiency to evaluate the operation
performance of ANSPs (Air Navigation Service Providers) and AOs (Aerodrome Operators) should be
used. Furthermore, this would improve the performance of air transportation system and aid decision
making for ANSPs and AOs.
1.4 Most of current practice for KPA and KPI can be found in the International Civil Aviation
Organization (ICAO). A review of current practice which is carried out by ANSPs and national
regulating authorities shows that most organizations attempt to comply with the ICAO framework when
monitoring performance. However, not all KPAs have useful KPIs to provide stakeholders with unique
information. The following sources provide some of the additional information of KPAs and KPIs,
which are regionally and globally used:
Global Air Traffic Management Operational Concept (ICAO Doc 9854) International
Civil Aviation Organization, 2005.
Global Air navigation plan (ICAO Doc 9750), International Civil Aviation
Organization, 2013.
Manual on Global Performance of the Air Navigation System (ICAO Doc 9883),
International Civil Aviation Organization, 2009.
EUR Region Performance Framework Document (EUR Doc 030), International Civil
Aviation Organization, 2014.
Airport CDM Implementation, European Organization for the Safety of Air
Navigation, 2012.

Asia-Pacific Air Traffic Management Performance Measurement Framework V1.0
2
The PRC’S European ATM Performance Measurement System, European
Organization for the Safety of Air Navigation, 2011.
Comparison of Air Traffic Management-Related 2013 Operational Performance:
U.S./Europe, EUROCONTROL/FAA Air Traffic Organization System Operations
Services, 2014.
Performance Review Report: An Assessment of ATM in EUROPE during the
Calendar Year 2014, European Organization for the Safety of Air Navigation, 2015.
Recommended Key Performance Indicators for Measuring ANSP Operational
Performance, civil air navigation services organization, 2015.
Services Charter 2014/15-2015/16, Airservices Australia, 2015.
A brief to china’s ATM KPIs, 2014.
The report of china civil flights operation efficiency in 2014, Airspace Operation
Center of China,2015.
European Union Regulation (EU) No 390/2013,
UK NATS Fuel Efficiency Metric (3Di)
1.5 In consideration of serviceability of those practices, ICAO and EUROCONTROL’s work
was used as reference. ICAO has identified 11 KPAs for monitoring performance of ATM system,
which have been described in ICAO’s Global Air Traffic Management Operational Concept Report
(Doc 9854) and Manual on Global Performance of the Air Navigation System (Doc 9883). Those
documents contain a high level description of goals of the Performance-Based Approach (PBA) to
management, especially the Doc 9883 which describes the foundational requirements for measuring
performance and a list of key performance indicators (KPIs) that may be considered for tracking
operational performance.
1.6 Following the 12th Air Navigation Conference (ANC/12), ICAO produced the Global Air
Navigation Plan 2013-2018, Fourth Edition (Doc 9750) (GANP). This document specifies air
navigation technology improvements as a series of ‘Aviation System Block Upgrades’ (ASBUs), which
is a programmatic and flexible global system engineering approach to allowing all Member States to
advance their air navigation capabilities based on their specific operational requirements. The ultimate
objective of ICAO is to urge all Member States to align their future aviation system developments
against the GANP to achieve a seamless sky and global harmonization. The Sixth Edition of the GANP
(2019) is taken as reference.
1.7 More detailed information on the ASBUs is provided on the ICAO GANP Portal at
https://www4.icao.int/ganpportal/.
1.8 As is shown in Figure 1, ICAO has identified a number of concepts to describe different
elements which have different characters and function. This introduces the concept of the performance
evaluation framework to refine the indicators.
Asia-Pacific Air Traffic Management Performance Measurement Framework V1.0
3
Figure 1: ICAO Performance Evaluation Framework
1.9 Moreover, CANSO’s safety programme helps ANSPs improve safety through elements
such as safety management systems, best practices and benchmarking. Seeking predictive measures of
risk and positive safety performance metrics, the Safety Performance Measurement Workgroup
(SPMWG) in Canso creates new leading indicators so that members of CANSO can better understand
their safety performance and risk control effectiveness.
1.10 In China, CAAC (Air Traffic Management Bureau) formulates the Civil Aviation ATM
Modernization Strategy(CAAMS). CAAMS evolves from navigation alone to providing
comprehensive ATM services, in combine with the Required Communication Performance (RCP),
Required Navigation Performance (RNP) and Required Surveillance Performance (RSP) of airborne
system and ground system, so as to provide differentiated ATM service capability based on different
performance levels and requirements of airspace users. Besides, CAAMS has developed a complete
performance system about its main tasks, including safety, capacity, efficiency, service, management.

Asia-Pacific Air Traffic Management Performance Measurement Framework V1.0
4
FRAMEWORK COMPOSITION
Key Performance Areas
2.1 There are a number of features of the air transport system which have constraints imposed
by external bodies. These constraints reduce the ability of stakeholders to make a full trade-off between
KPAs. The requirements imposed by external agencies must be strictly observed and performance must
be optimized subject to those requirements.
2.2 Over and above these constraints, there are trade-offs that can be made. For example, an
ATSP may choose to implement a higher level of safety than imposed by the regulator if it believes this
reflects the users’ preferences. This choice would be made in the full knowledge that there would be
trade-offs with other KPAs e.g. delays may increase or costs would be higher.
2.3 It is possible that the regulatory process may facilitate this type of information exchange
between users and ATS Providers by establishing a formal means of consultation. Since trade-offs
between the key performances areas are inevitable, it is necessary to ensure that the trade-offs that will
be made are done in such a way as to increase the overall benefits of the system to users.
2.4 To assist the process of assessing the costs and benefits of the trade-offs it is necessary to
have an over-arching objective for the air transport system. An appropriate objective is to give users
over the long term safe services and the levels of capacity and quality they require, and for which they
are prepared to pay, with price being based on the costs of efficient operations.”
2.5 With a focus on this objective, stakeholders can decide how changes to the current system
will increase the benefits over and above the status quo and how this will be monitored by the indicators.
For example, if demand for ATS is expected to grow beyond the present capacity of the system there
are two possible outcomes. If capacity does not expand to meet the demand then indirect costs will
increase due to, for example, additional delays.
2.6 If capacity is increased to cope with the additional demand, the direct cost of providing
ATS will increase. There is a direct conflict between indicators measuring delays and indicators
measuring cost. The decision to go ahead with the capacity increase will depend on the relative value
users place on increased delays that will occur when current capacity is fully utilized and the increased
cost of ATS necessary to fund the extra capacity. The desired response is for additional capacity to be
provided up to the point where the additional benefits cover the extra costs.
2.7 As the Asia-Pacific Seamless ATM Plan said, the applicability of Preferred
Aerodrome/Airspace, Route Specifications (PARS) and Preferred ATM Service Levels (PASL) should
be verified by analysing safety, current and forecast traffic demand, efficiency, predictability, cost
effectiveness and environment to meet expectations of stakeholders. In those KPAs, cost effectiveness
and environment are highly related to efficiency, and traffic demand has also been embodied in capacity.
Capacity
2.8 Capacity of airport terminal, runway and en-route ATC sector mentioned in the
performance improvement plan of the Asia-Pacific Seamless ATM Plan should be monitored and
assessed. In research and development part, the problem about balancing demand and capacity is
emphasized to be integrated within the ATM system. There are some specific requirements in ASBU.
Before 2018 Asia-Pacific ATM performance of capacity was expected to reach the standard level of
Block 0. For example, B0-APAT, B0-RESQ, B0-ACDM in performance improvement areas of greener
airport are mentioned in order to improve the capacity of runway, namely, the capacity bottleneck.
2.9 Never before has air transport been so rapidly developing as it is today. Accordingly,
compared with the early stage of development, the complexity of air traffic environment is increasing

Asia-Pacific Air Traffic Management Performance Measurement Framework V1.0
5
as well.
2.10 The method of how to accurately , reasonably and effectively assess airspace and airport
capacity will become the most important basis of the implementation of air traffic flow management,
maintain the balance of airspace system between supply and demand and improve the flight punctuality.
Capacity is the description of airspace and airport capability. To meet the demand of air traffic, it is
needed to select and implement comprehensive capacity assessment indicators to improve the ability to
assess the accuracy and timeliness of the results.
2.1 It will bring benefits to improvement and perfection of airspace and airport management
and can help to improve level of air traffic flow management, go further to promote air space proper
planning. It has an extremely important significance to alleviate the contradiction between the
increasing air traffic flow and the scarce air space resource. Next, assess air space capacity from the
perspective of the spatial dimension and the match of capacity and demands.
2.11 All of capacity KPIs should be implemented in Stage 1.
Efficiency
2.12 Efficiency, the same as safety, is another main goal of Asia-Pacific Seamless ATM
operations plan. Asia-Pacific Seamless ATM Plan divides the operation phase into aerodrome
operation, terminal operation and en-route operation to execute performance evaluation and
performance improvement plan. So, our report establishes a phased evaluation approach according to
the plan to making a fine analysis and finding the targeted pressure point. The seamless skies initiative
is designed to improve the efficiency of air navigation services through increased harmonization,
interoperability and flight path optimization which are detailed in B0-SURF, B0-FICE, B0-AMET, B0-
RESQ, B0-ACDM, B0-FRTO, B0-OPFL, B0-TBO, B0-CDO and B0-CCO.
2.13 The efficiency of air traffic control department reflects the utilization of airspace resources.
As Doc.9883 stated, efficiency should comprise both “Temporal Efficiency” (i.e. delay) and “Flight
Efficiency” (trajectory oriented), so the indicators are enumerated to assess the efficiency of air traffic
control system from the dimension of time and space.
Time Dimension
2.14 Based on a time dimension for evaluating efficiency, indicators which are called delay or
additional flight time, mainly reflect the difference between estimated or unimpeded time and actual
time by each airspace unit. Due to large difference in operating characteristics of each flight phase and
management of ANSPs, it is necessary to evaluate the efficiency of aircraft in terms of different flight
phases.
Space dimension
2.15 The space discussed here not only refers to habitable three-dimensional space but also the
conditional space of capacity and complexity etc. Efficiency based on the dimension of space is the
utilization ratio of space resource of ANSPs.
2.16 Flight Efficiency under space dimension can be measured in terms of the deviation from
four- dimension trajectory or flight dynamic data.(i.e. number of changing heading) Deviation can take
several forms and include additional route length, non-optimum vertical profile, speed differences from
the optimum, additional taxi time and time in stack. For example, a measure of efficiency should be
based on fuel consumption, though it varies markedly by phase of flight.
2.17 Comparing total fuel consumption for a given journey with the optimum for aircraft types
in service, might be a better measure. However, this was abandoned considering the accessibility of fuel

Asia-Pacific Air Traffic Management Performance Measurement Framework V1.0
6
consumption data.
Predictability
2.18 Predictability is defined in ICAO document 9854, Global Air Traffic Management
Operational Concept as the “ability of airspace users and ANSPs to provide consistent and dependable
levels of performance”. If delay is entirely predictable at different time of a day not varying from its
predicted value, an aircraft operator will calculate anticipated delays in consideration of schedule and
flights will always arrive on time. As delay variability grows, more and more disruption will influence
an aircraft operator’s schedule and flight connectivity will be damaged. Lateness causes increased
operating costs for an aircraft operator due to the inefficient use of resources and support facilities.
Earliness could be considered as a lost opportunity for fleet and crew usage.
2.19 Similar to efficiency focusing on the utilization of resource, predictability, however, pays
particular emphasis on consistent and efficient use of airspace or other resource based on flight plan
and history data.
Safety
2.20 In the Asia/Pacific region, safety is certainly the number one priority of air navigation
service providers. For this reason, a large share of KPIs and activities supporting this over-arching goal
are related to safety. To ensure that safety remains an integral part in evolution of aviation system which
becomes more and more complex, States and service providers are encouraged to proactively engage in
safety risk modelling. The improved understanding of how various elements of ATM system contribute
to overall safety levels can not only help to better identify risk areas today but also ameliorate the system
to improve performance in the future.
2.21 For safety performance metrics, there is specific working group to study and promote the
performance indicators. In the construction of this framework, safety is taken as an individual section
which will not be focused on. However, relevant indicators are provided as reference.
2.22 According to ICAO, within the safety KPA common metrics focus on the number of
accidents normalized through the number of operations or the total flight hours. Differences arise in
definition of terms and filtering criteria are used for data counting. The part introduces some KPIs for
evaluating the management level and going further to improve the safety performance. Indicators are
divided into lagging indicators and leading indicators. Lagging indicators are some statistics about
aviation safety accident and potential accident, which reflect the aviation safety condition directly;
leading indicators is safety predication indicator which could analysis flight operation situation through
civil aviation big data to predict pressure point and ensure the aviation safety in strategy and pre-tactical
phase.
2.23 Accident occurrences only provide a limited insight into flight operations safety, in part
because they represent a very narrow range from which to draw conclusions. Traditional accident or
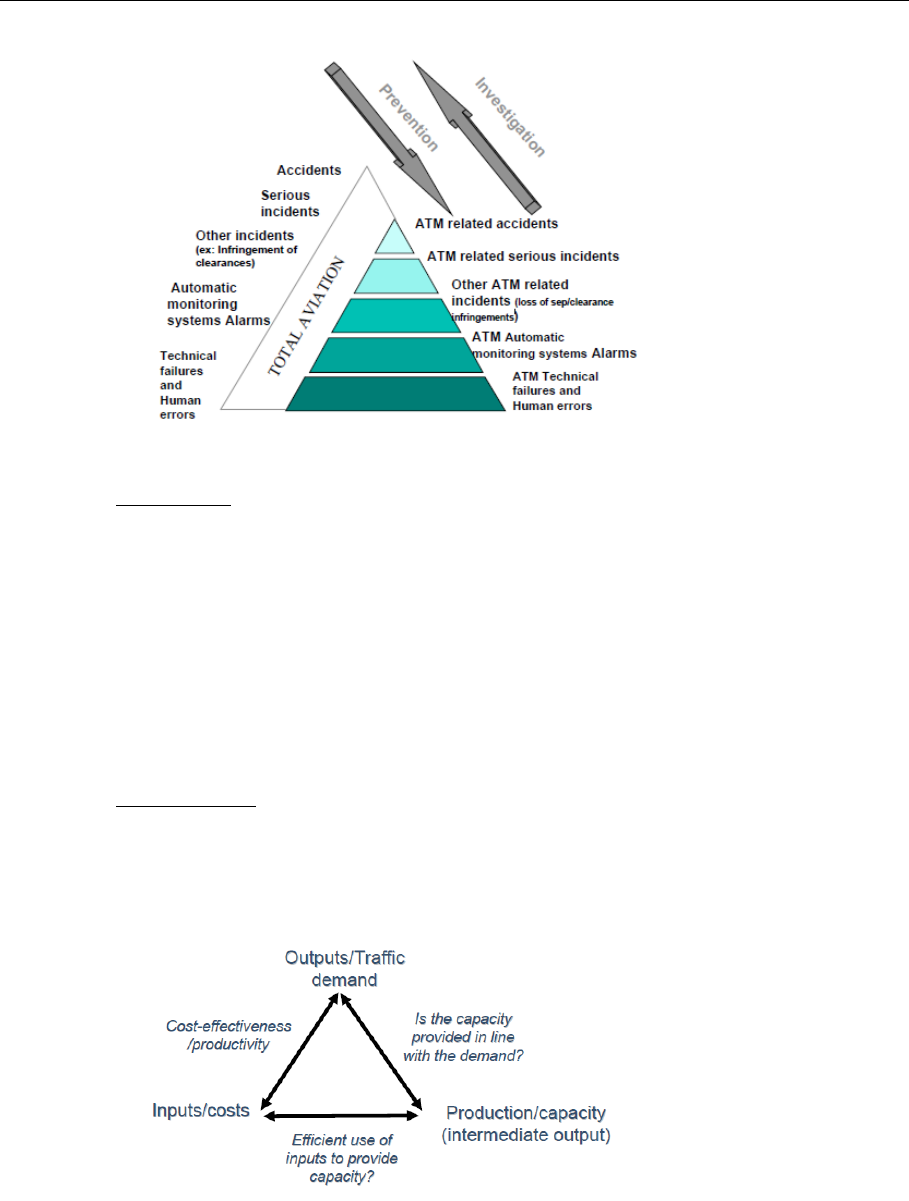
serious incident reports may only reveal the tip of the pyramid. Therefore, as illustrated in Figure 2, the
SRC intends to adopt progressively a more thorough approach to safety performance measurement.
2.24 The role of ATM safety is to ensure adequate separation of aircraft from one another, from
other objects and from the ground. The principal basis of the SRC assessment of safety performance
therefore reflects this role, and mainly consists of measurement of the ATM contribution to aircraft
accidents and incidents, for all types of operations occurring in all classes of airspace, categorized
according to the level of risk and expressed in terms of air to air, air to ground or ground to ground
safety occurrences.
Asia-Pacific Air Traffic Management Performance Measurement Framework V1.0
7
Figure 2: Safety triangle
Environment
2.25 According to the development plan of Asia/Pacific Seamless ATM Plan, environment is
one of the requisite performance objective areas for meeting the expectation of stakeholders.
Considering the technical aspect of Asia-Pacific region, many countries can’t meet the requirement of
data statistics. In the view of PRU, the performance of environment could be expressed by inefficiency
in terms of time, fuel and emission. But in Asia-Pacific region, inappropriate city planning makes noise
of flight during the operation phase of approaching and climbing a serious problem. Those KPIs are
expected to help Asia-Pacific region to abate the adverse impact on environment in the future. So in the
first implement stage which has been defined in this report, some efficiency KPIs are used as
alternatives.
Cost-Efficiency
2.26 There is a high level of heterogeneity in the Air Navigation Services (ANS) industry. The
relationship between inputs and outputs of provision of ATM/CNS services is obviously displayed in
Figure 3. [ANSPs econometric cost-efficiency benchmarking].
Figure 3: Relationship between costs and outputs
2.27 An ANSP provides a specific level of ATC capacity which is determined by the number
of airspace sectors that can be opened in its airspace for a given duration. This ATC capacity is used to
cope with a specific and exogenous traffic demand (number of aircraft/flights that are planned to cross
the ANSP’s airspace).One could consider that the capacity provided by the ANSP corresponds to an
“intermediate” output while the “final” output would be measured in terms of traffic volumes controlled
in the ANSP’s airspace.

Asia-Pacific Air Traffic Management Performance Measurement Framework V1.0
8
2.28 The relationship between inputs/costs and final output/traffic demand depends on the
ANSP’s ability to efficiently use its resources to provide a certain level of ATC capacity and on the
extent to which the capacity provided is in line with the traffic demand. The overall “outcome” of this
process is the extent to which the flight (final output) has been safely controlled in a swift and timely
manner.
2.29 According to the development plan of Asia-Pacific Seamless ATM plan, the cost efficiency
is one of the four requisite performance objectives. And the implementation of ABSU Block upgrades
will require investment decision to be made by ANSPs. However, Asia-Pacific ANSPs operate in
operational and economic conditions that vary significantly from country to country. Significant time
is required to implement some KPIs and most of the cost KPIs are placed in the second stage.
Key Performance Indicators
2.30 An indicator is a unit or a method of performance measurement. Driven by data, it is based
on the expectation of performance improvement to select key performance indicators. Divided by the
way of function of KPI in each key performance area and differences in Dimensions of Statistics, it
systematically displays the hierarchical construction of indicator framework. Some indicators that get
more attention are separately defined to highlight its importance. Description of each key performance
indicator includes Measurement Units, Variants, Parameters, Data Requirement and References.
2.31 Relevantly, indicators need to correctly express the intention of the associated performance
objective. Since indicators support objectives, they should be defined to have a specific performance
objective in mind. Indicators are not often directly measured. They are calculated from supporting
metrics according to clearly calculation procedure.
Display forms of indicator value
2.32 As one of attributes of indicators, indicator value should have different display forms in
response to different analysis objects and assessment objectives. For example, totality highlights the
overall workload of air traffic system in statistics of flight time, which is applied to publication of
national statistics; average reflects the general operating state of aircraft in designated airspace; standard
deviation examines the deviation of operating state of the aircraft groups. Therefore, in this framework,
there appear no specific descriptions for display forms of such indicators, but gives available categories
to select from when facing different situations.
Induced factors of indicator value
2.33 Air traffic system is a complex system. The index value whose performance is a result of
both external and internal factors is used to determine main direction of optimization by division of
main responsibilities. Therefore, descriptions of induced factors of indicator value are added in this
framework when describing the display forms of indicators. For instance, different causes are given
according to different types of delays: en-route flight delays are subdivided into capacity constraints,
traffic control, weather, military training, pre-departure delay distribution and some other common
factors; causes of off-block delays include air traffic control, airport capacity constraints, weather,
turnover, pre-departure delay.
Supporting metrics
2.34 Supporting metrics are used to calculate the values of performance indicators and
determine which data need to be collected to calculate values for the performance indicators. The
supporting metrics define which data need to be collected and/or forecasted to calculate values for the
performance indicators.
2.35 Alternatively, the need for supporting metrics (such as the number of flights) lasts much

Asia-Pacific Air Traffic Management Performance Measurement Framework V1.0
9
longer because metrics are seldom indicator-specific, i.e. they are typically used to calculate a variety
of indicators. When deciding which data to collect, a sufficiently broad spectrum of supporting metrics
will have to be considered.
Implementation Stage
2.36 In fact, different countries in Asia-Pacific region have different methods and standards of
data collection and definition, but the calculation and application of KPIs need uniform standard. Then
set up three implement stages of KPIs (described in Table 1 in detail) to insure that each country could
make it standardized and have time to join the revision of standard. The first stage lasts until the year
2019, Stage 2 will continue until the year of 2021,and the last stage is expected to continue until 2023
(Figure 4).
Figure 4: Implementation Stages
2.37 KPIs in the first stage are easy to calculate because their rough definitions at time point
within large statistical range. And the second stage needs us to set detailed distinction in each phase of
flight operation as to different characteristics. More concern about flight dynamic information and the
impact of non-operation elements in the third stage is needed to improve the development of the
Asia/Pacific Seamless ANS Plan but also for the advancement of civil aviation in Asia-Pacific region.
The foundation of parting the implement stage is the flight phase. For example, indicators in the first
stage mean that the implement of indicators should both start and finish in this stage.
2.38 In the first stage, there are 10 indicators containing some fundamental and coarse-grain
statistic and simple calculation on basis of those statistics. Corresponding flight phases have been
divided into two main phases i.e. ground operation phase and runway-to-runway flight phase by the
differentiation between airport and airspace. In order to make those indicators unified and comparable
under now situation, the flight phase of runway-to-runway is defined from take-off to land of flights (as
is shown in Figure 5).
2.39 The second stage is up to 13 indicators. In this stage, the flight phase partition is more
detailed and runway-to-runway flight phase is split into terminal departure, en-route, terminal arrival,
and phase. Corresponding discontinuous points is the time of take-off, passing terminal departure fix,
passing terminal arrival fix, landing. The ground operation phase is divided into turnaround, taxi-in and
taxi out phases, and adding off-block and in-block time as discontinuous points. The data collection and
performance evaluation need flight plan and actual time information such as FPL, ADS-B and radar
data.
2.40 Finally, the third stage cares more about flight dynamic information and some
nonoperation factors (i.e. climbing, cruising and descending).
Stage 1(2019)
•Fundamental
measurement
Stage 2(2021)
•Dynamic
measurement
Stage 3(2023)
•Comprehensive
measurement

Asia-Pacific Air Traffic Management Performance Measurement Framework V1.0
10
Runway-to-Runway flight phaseGround operationStage 1
Stage 2
Taxi-out Terminal departure
Stage 3
En-route
Terminal
departure fix
Take-off
Terminal
arrival fix
In-block
Climbing
Cruising
Descending
Land
Off-block
Ground operation
Taxi-in
Land
Terminal arrival
Take-off
Off-block
In-block
Flight
life-cycle
Figure 5: Flight life cycle in different implement stages
2.41 The specific indicator framework is shown below. Between KPAs and KPIs, some
categories are set to make KPIs more regular. Furthermore, the level of KPIs is introduced in order to
increase the engagement and participation of this plan. So, in this column ‘SR’ means those indicators
are strongly recommended to complete to meet the need of performance measurement and ‘R’ shows
they are recommended to finish in this stage. More detailed introduction is discussed in the following
section.
Indicator Measurement Roadmap
2.42 As the Asia/Pacific is a region with so many diversified countries, a strategic plan in
carrying out the relative indicator measurement is necessary. In the first phase, the Framework is already
set, thus some more advanced States could provide technical support to other States, such as the way of
collecting data, the computation algorithm, and some guidelines as to how to implement the
measurement work. This should encourage more and more participants to voluntarily take part in the
work and adopt the KPIs.
2.43 In the second phase, more advanced States could build a platform as a sharing tool for the
measurement as well as a demonstration of these tools to show the outcomes of the measurement work
by some of the participants in the field. Sharing is also optional.
2.44 In the third phase, a data sharing platform could be built by consensus.
KPAs
Categories
ID
KPIs
Stage1
Stage2
Stage3
Capacity
Capacity
value
KPI01
Airport peak arrival capacity
(GANP)
SR
1
KPI02
Airport peak departure capacity
SR
1
KPI03
En-route sector capacity (GANP)
R
2
Capacity
utilization
KPI04
Airport arrival capacity utilization
(GANP)
R
2
SR
3
KPI05
Airport departure capacity
utilization
R
2
SR
3
KPI06
En-route sector capacity
utilization
R
3
Efficiency
Additional
flight time
KPI07
Additional runway-to-runway
time
R
1
R
2
KPI08
Additional en-route flight time
R
3
KPI09
Additional taxi-in time (GANP)
R
1
SR
2

Asia-Pacific Air Traffic Management Performance Measurement Framework V1.0
11
KPI10
Additional taxi-out time (GANP)
R
1
SR
2
KPI11
Additional runway occupation
time
R
3
KPI12
Additional terminal area arrival
flight time (GANP)
R
2
Delay
KPI13
Arrival delay
R
1
KPI14
Departure delay
R
1
KPI15
En-route airspace ATFM
delay(GANP)
R
3
KPI16
Airport/Terminal ATFM
delay(GANP)
R
3
KPI17
Delay on board (newly added)
R
3
Level
flight
efficiency
KPI18
Filed flight plan en-route
extension rate(GANP)
R
3
KPI19
Actual en-route extension
rate(GANP)
R
3
Flow
KPI20
Airport arrival throughput
(GANP)
R
1
SR
2
KPI21
Airport departure throughput
R
1
SR
2
Predictability
Flight time
KPI22
Flight arrival punctuality (GANP)
R
1
SR
2
KPI23
Flight departure punctuality
(GANP)
R
1
SR
2
KPI24
Flight time variability (GANP)
R
2
KPI25
Flight plan variation (newly
added)
R
3
KPI26
ATFM slot adherence (GANP)
(newly added)
R
2
Flight
distance
KPI18
Filed flight plan en-route
extension rate (GANP)
R
3
Flow
demand
KPI04
Airport arrival capacity utilization
(GANP)
R
1
SR
2
KPI05
Airport departure capacity
utilization
R
1
SR
2
KPI06
En-route sector capacity
utilization
R
2
Environment
Indirect
environme
nt
influence
KPI27
Additional fuel burn (GANP)
R
3
KPI19
Actual en-route extension rate
(GANP)
R
3
Cost-
efficiency
Outputs
KPI28
ANSP’s Cost of Per IFR hours
(newly added)
Table 1: KPIs in different stages

Asia-Pacific Air Traffic Management Performance Measurement Framework V1.0
12
KPI FRAMEWORK – FIRST STAGE
Key Performance Indicators Framework in the First Implementation Stage
3.1 According to the partition of implementing stage in the executive summary, the most
fundamental indicators framework are built in this stage which data is easily to collect and don’t need
special definition of flight phase. Those indicators mostly reflect performance of the entire flight phase.
ID
KPIs
Level
KPAs
KPI01
Airport peak arrival capacity
SR
Capacity, Cost-efficiency
KPI02
Airport peak departure capacity
SR
Capacity, Cost-efficiency
KPI09
Additional taxi-in time
R
Efficiency
KPI10
Additional taxi-out time
R
Efficiency
KPI13
Arrival delay
R
Efficiency
KPI14
Departure delay
R
Efficiency
KPI20
Airport arrival throughput
R
Efficiency, Cost-efficiency
KPI21
Airport departure throughput
R
Efficiency, Cost-efficiency
KPI22
Flight arrival punctuality
R
Predictability
KPI23
Flight departure punctuality
R
Predictability
Table 2: KPIs in Stage1
Capacity
3.2 Capacity could reflect an upper bound on the allowable throughput of an en-route facility
or sector or indicates the highest landing or take-off rate that an airport will accept, using the most
favorable runway configuration under optimum operational conditions.
KPI Name
Airport peak arrival capacity
ID
KPI01
Definition
The highest number of landings an airport can accept in a one-hour time
frame.
Measurement
Units
Number of landings / hour
Variants
None
Parameters
None
Data
requirement
Scheduling parameters for slot controlled airports
Airport Acceptance Rates (AAR)
Calculation
procedure
At the level of an individual airport:
1. Select highest value from the set of declared arrival capacities
2. Compute the KPI: convert the value to an hourly landing rate, if the
declaration is at smaller time intervals
References
Comparison of ATM-Related Operational Performance: U.S./Europe
(June 2014)
CANSO Recommended KPIs for Measuring ANSP Operational
Performance (2015)
2016-2030 Global Air Navigation Plan(Doc 9750-AN/963 Fifth Edition -
2016)
KPI Name
Airport peak departure capacity
ID
KPI02
Definition
The highest number of take-offs an airport can release to departure in a

Asia-Pacific Air Traffic Management Performance Measurement Framework V1.0
13
one-hour time frame.
Measurement
Units
Number of take-offs / hour
Variants
None
Parameters
None
Data
requirement
Scheduling parameters for slot controlled airports
Calculation
procedure
At the level of an individual airport:
1. Select highest value from the set of declared departure capacities
2. Compute the KPI: convert the value to an hourly take-off rate, if the
declaration is at smaller time intervals
Reference
Comparison of ATM-Related Operational Performance: U.S./Europe
(June 2014)
CANSO Recommended KPIs for Measuring ANSP Operational
Performance (2015)
2016–2030 Global Air Navigation Plan(Doc 9750-AN/963 Fifth Edition
– 2016)
Efficiency: Additional Flight Time
3.3 Those KPIs are intended to give an indication of the efficiency of each flight phase
operations on the surface or en-route.
KPI Name
Additional taxi-in time
ID
KPI09
Definition
Actual taxi-in time compared to an unimpeded/reference taxi-in time
Measurement
Units
Minutes/flight
Variants
Variant 1 – basic (computed without landing runway and arrival gate
data)
Variant 2 – advanced (computed with landing runway and arrival gate
data)
Parameters
Unimpeded/reference taxi-in time:
-Recommended approach for the basic variant of the KPI: a single value
at airport level, e.g. the 20
th
percentile of actual taxi times recorded at an
airport, sorted from the shortest to the longest
-Recommended approach for the advanced variant of the KPI: a separate
value for each runway/gate combination, e.g. 20th percentile of actual
taxi-in time recorded.
Data
requirement
For each arriving flight:
- Actual landing time (ALDT)
- Actual in-block time (AIBT)
In addition for the advanced KPI variant:
- Landing runway ID
- Arrival gate ID
Calculation
procedure
At the level of individual flights:
1. Select arrival flights, exclude helicopters
2. Compute actual taxi-in duration: AIBT minus ADLT
3. Compute additional taxi-out time: actual taxi-out duration minus
unimpeded taxi-in time
At aggregated level:
4. Compute the KPI: sum of additional taxi-in times divided by number
of IFR arrivals

Asia-Pacific Air Traffic Management Performance Measurement Framework V1.0
14
References
Comparison of ATM-Related Operational Performance: U.S./Europe
(June 2014)
PRC Performance Review Report (EUROCONTROL 2015)
CANSO Recommended KPIs for Measuring ANSP Operational
Performance (2015)
2016-2030 Global Air Navigation Plan(Doc 9750-AN/963 Fifth Edition-
2016)
Notes: In order to stress the seasonal influences, data should be uploaded monthly refer
to the statistical period of the additional runway-to-runway time.
KPI Name
Additional taxi-out time
ID
KPI10
Definition
Actual taxi-out time compared to an unimpeded/reference taxi-out time
Measurement
Units
Minutes/flight
Variants
Variant 1 – basic (computed without departure gate and runway data)
Variant 2 – advanced (computed with departure gate and runway data)
Parameters
Unimpeded/reference taxi-out time:
- Recommended approach for the basic variant of the KPI: a single
value at airport level, e.g. the 20th percentile of actual taxi times
recorded at an airport, sorted from the shortest to the longest
- Recommended approach for the advanced variant of the KPI: a
separate value for each gate/runway combination, 20th percentile of
actual taxi-out time recorded.
Data
requirement
For each departing flight:
- Actual off-block time (AOBT)
- Actual take-off time (ATOT)
In addition for the advanced KPI variant:
- Departure gate ID
- Take-off runway ID
Calculation
procedure
At the level of individual flights:
1. Select departing flights, exclude helicopters
2. Compute actual taxi-out duration: ATOT minus AOBT
3. Compute additional taxi-out time: actual taxi-out duration minus
unimpeded taxi-out time
At aggregated level:
4. Compute the KPI: sum of additional taxi-out times divided by number
of IFR departures
References
Comparison of ATM-Related Operational Performance: U.S./Europe
(June 2014)
PRC Performance Review Report (EUROCONTROL 2015)
CANSO Recommended KPIs for Measuring ANSP Operational
Performance (2015)
2016-2030 Global Air Navigation Plan(Doc 9750-AN/963 Fifth Edition-
2016)
Notes: In order to stress the seasonal influences, data should be uploaded monthly refer
to the statistical period of the additional runway-to-runway time.

Asia-Pacific Air Traffic Management Performance Measurement Framework V1.0
15
Delay
3.4 This part gives lots of forms of delay, which could be used as average value and standard
deviation to meet different demand of statistics in macroscopic scale and parallel comparison.(i.e.
average delay contains the average delay of all flights or all delayed flights.) Many KPIs of delay that
may be implemented for the different phases of flight cycle compare an actual time against a scheduled
time for the purpose of determining a delay. However, there are often two additional conditions that are
met before an event is determined to be inefficient. These include meeting a minimum threshold for
delay as well as information on causal factors. Typical minimum thresholds include 5, 10 or 15 minutes.
KPI Name
Arrival delay
ID
KPI13
Definition
Actual in-block time compared to a schedule time of arrival [avg. per
airport or per cluster of airports]
Measurement
Units
Minutes/flight
Variants
Variant 1 – basic (computed for all flights )
Variant 2 – advanced (computed for delayed flights )
Parameters
Threshold of delayed flights:
-Recommended value: 15 minutes
Data
requirement
For each arriving flight:
- Schedule Time of Arrival (STA)
- Actual In-block Time (AIBT)
Calculation
Procedure
For Variant 1:
At the level of individual flights:
1.Select arriving flights
2.Compute arrival delay: AIBT minus STA
At aggregated level:
3.Compute the KPI: sum of arrival delays divided by number of arrivals
For Variant 2:
At the level of individual flights:
1.Select arriving flights
2.Compute arrival delay: AIBT minus STA
3.Use parameters to determine which flight is delayed
At aggregated level:
1.Compute the KPI: sum of arrival delays divided by number of delayed
arrivals
References
Manual on Global Performance of the Air Navigation System(Doc.9883
First Edition — 2009)
Notes: Referring to the indication of delay, KPIs of delay will show different statistical
characteristics in distinct uploading or statistical periods. If just handing in the results of
calculation, it would be better to upload the data by month to show the seasonal
influence.
KPI Name
Departure delay
ID
KPI14
Definition
Actual off-block time compared to schedule time of departure [avg. per
airport or per cluster of airports]
Measurement
Units
Minutes/flight
Variants
Variant 1 – basic (computed for all flights )
Variant 2 – advanced (computed for delayed flights )
Parameters
Threshold of delayed flights:

Asia-Pacific Air Traffic Management Performance Measurement Framework V1.0
16
-Recommended value: 15 minutes
Data
requirement
For each departing flight:
- Scheduled time of departure (STD)
- Actual off-block time (AOBT)
Calculation
Procedure
For Variant 1:
At the level of individual flights:
1.Select departure flights
2.Compute departure delay: AOBT minus STD
At aggregated level:
3.Compute the KPI: sum of departure delays divided by number of
departures
For Variant 2:
At the level of individual flights:
1.Select departure flights
2.Compute arrival delay: AOBT minus STD
3.Use parameters to determine which flight is delayed
At aggregated level:
1.Compute the KPI: sum of departure delays divided by number of
delayed departures
References
Manual on Global Performance of the Air Navigation System(Doc.9883
First Edition — 2009)
Notes: Similarly, KPIs of delay will show different statistical characteristics in distinct
uploading or statistical periods. If just handing in the results of calculation, it should be
uploaded by month to show the seasonal influence.
Flow
3.5 Traffic flow means the number of flights served by airport or airspace. Average value
reflects the common demand and peak value tells the effectively realized capacity.
KPI Name
Airport arrival throughput
ID
KPI20
Definition
The number of landings recorded at an airport under normal conditions
in a given time period
Measurement
Units
Flights/hr
Variants
Variant 1: average
Variant 2: peak throughput
Parameters
For variant2:
The 95th percentile of the hourly number of landings recorded at an
airport, in the “rolling” hours sorted from the least busy to the busiest
hour.
Time interval for “rolling” hours. Recommended value: 15 minutes.
The percentile chosen to exclude outliers. Recommended value: 95th
percentile.
Data
requirement
For each arriving flight:
- Actual landing time (ALDT)

Asia-Pacific Air Traffic Management Performance Measurement Framework V1.0
17
Calculation
Procedure
For Variant 1:
1.Select arrival flights
2.Compute the throughput: count the number of actual landings in a
given period based on ALDT
3.Compute the KPI: throughput divided by number of the selected hours
For Variant 2:
1. Select arrival flights
2. Convert the set of landings to hourly landing rates by “rolling” hour
3. Sort the “rolling” hours from the least busy to the busiest hour
4. Compute the KPI: it equals the landing rate value of the 95th
percentile of the “rolling” hours
Reference
Manual on Global Performance of the Air Navigation System(Doc.9883
First Edition — 2009)
2016-2030 Global Air Navigation Plan(Doc 9750-AN/963 Fifth Edition-
2016)
KPI Name
Airport departure throughput
ID
KPI21
Definition
The number of take-offs recorded at an airport under normal conditions
in a given time period
Measurement
Units
Flights/hr
Variants
Variant 1: average
Variant 2: peak throughput
Parameters
For variant1:
…
For variant2:
The 95th percentile of the hourly number of landings recorded at an
airport, in the “rolling” hours sorted from the least busy to the busiest
hour.
Time interval for “rolling” hours. Recommended value: 15 minutes.
The percentile chosen to exclude outliers. Recommended value: 95th
percentile.
Data
requirement
For each departing flight:
- Actual take-off time (ATOT)
Calculation
Procedure
For Variant 1:
1.Select departing flights
2.Compute the throughput: count the number of actual take-offs in a
given period based on ALDT
3.Compute the KPI: throughput divided by number of the selected hours
For Variant 2:
1. Select departing flights
2. Convert the set of take-offs to hourly departing rates by “rolling” hour
3. Sort the “rolling” hours from the least busy to the busiest hour
4. Compute the KPI: it equals the departing rate value of the 95th
percentile of the “rolling” hours
Reference
Manual on Global Performance of the Air Navigation System x
(Doc.9883 First Edition — 2009)
2016-2030 Global Air Navigation Plan(Doc 9750-AN/963 Fifth Edition-
2016)

Asia-Pacific Air Traffic Management Performance Measurement Framework V1.0
18
Predictability: Flight Time
KPI Name
Flight arrival punctuality
ID
KPI22
Definition
Percentage of flights arriving at the gate on-time (compared to schedule)
Measurement
Units
Percentage(%)
Variants
Variant1 – arrival punctuality after 15 minutes of Scheduled time(SOBT)
of arrival
Parameters
On-time threshold (maximum delay from Scheduled time of arrival)
which defines whether a flight is counted as on-time or not.
Recommended values: 15 minutes.
Data
requirement
For each arriving scheduled flight:
- Scheduled time of arrival (STA)
- Actual in-block time (AIBT)
Calculation
Procedure
At the level of individual flights:
1.Exclude non-scheduled arrivals
2.Categorize each scheduled arrival as on-time or not ( flights arriving
ahead of schedule defaulted to be on time )
At aggregated level:
1.Compute the KPI: number of on-time arrivals divided by total number
of scheduled arrivals
References
Comparison of ATM-Related Operational Performance: U.S./Europe
(June 2014)
2016-2030 Global Air Navigation Plan(Doc 9750-AN/963 Fifth Edition-
2016)
KPI Name
Flight departure punctuality
ID
KPI23
Definition
Percentage of flights departing from the gate on-time (compared to
schedule)
Measurement
Units
Percentage (%)
Variants
Variant 1 – departure punctuality after 15 minutes of Scheduled
time(SOBT) of departure
Parameters
On-time threshold (maximum delay from Scheduled time of departure)
which defines whether a flight is counted as on-time or not.
Recommended values: 15 minutes.
Data
requirement
For each departing scheduled flight:
- Scheduled time of departure (STD)
- Actual off-block time (AOBT)
Calculation
Procedure
At the level of individual flights:
1.Exclude non-scheduled departures
2.Categorize each scheduled departure as on-time or not
At aggregated level:
3.Compute the KPI: number of on-time departures divided by total
number of scheduled departures
References
Comparison of ATM-Related Operational Performance: U.S./Europe
(June 2014)
2016-2030 Global Air Navigation Plan(Doc 9750-AN/963 Fifth Edition-
2016)

Asia-Pacific Air Traffic Management Performance Measurement Framework V1.0
19
Environment
Cost-efficiency – Immediate Outputs
3.6 KPI01 Airport peak arrival capacity (refer to Capacity)
3.7 KPI02 Airport peak departure capacity (refer to Capacity)
Cost-efficiency – Immediate Outputs
3.8 KPI20 Airport arrival throughput (refer to Efficiency – Additional Flight Time)
3.9 KPI21 Airport departure throughput (refer to Efficiency – Additional Flight Time)

Asia-Pacific Air Traffic Management Performance Measurement Framework V1.0
20
KPI FRAMEWORK – SECOND STAGE
Key Performance Indicators Framework in the First Implementation Stage
4.1 In the second stage, more detailed information of flight life cycle to design indicators are
introduced.
ID
KPIs
Level
KPAs
KPI03
En-route sector capacity
R
Capacity, Cost-efficiency
KPI04
Airport arrival capacity utilization
R
Capacity, Predictability
KPI05
Airport departure capacity utilization
R
Capacity, Predictability
KPI07
Additional runway-to-runway time
R
Efficiency
KPI09
Additional taxi-in time
SR
Efficiency
KPI10
Additional taxi-out time
SR
Efficiency
KPI12
Additional terminal area arrival flight time
R
Efficiency
KPI20
Airport arrival throughput
SR
Efficiency, Cost-efficiency
KPI21
Airport departure throughput
SR
Efficiency, Cost-efficiency
KPI22
Flight arrival punctuality
SR
Predictability
KPI23
Flight departure punctuality
SR
Predictability
KPI24
Flight time variability
R
Predictability
KPI26
ATFM slot adherence
R
Predictability
Table 3: KPIs in Stage2
KPI Name
En-route sector capacity
ID
KPI03
Definition
The maximum number of movements an airspace volume will accept
under normal conditions in a given time period (also called declared
capacity)
Measurement
Units
Movements/quarter
Variants
None
Parameters
Time interval at which to perform the most granular calculations.
Recommended value: 15 minutes.
Data
requirement
Declared capacities are determined by the ANSP, and are dependent on
traffic pattern and sector configuration.
Calculation
procedure
At the level of an individual en-route airspace unit:
1. Select highest value from the set of declared capacities (the maximum
configuration capacity)
2. Compute the KPI: convert the value to movement rate in a quarter, if
the declaration is at smaller or larger time intervals
References
CANSO Recommended KPIs for Measuring ANSP Operational
Performance (2015)
2016–2030 Global Air Navigation Plan(Doc 9750-AN/963 Fifth Edition
– 2016)

Asia-Pacific Air Traffic Management Performance Measurement Framework V1.0
21
Capacity Utilization
4.2 Capacity utilization can directly reflect the Capacity utilization which helps push for the
further improvement of capacity management.
KPI Name
Airport arrival capacity utilization
ID
KPI04
Definition
Airport arrival throughput (accommodated demand) compared to arrival
capacity. The arrival capacity refer to the declared capacity at present, in
later stages, it could be replaced by dynamic capacity.
KPI should be strongly recommended if the airport runs near capacity.
Measurement
Units
Percentage (%)
Variants
None
Parameters
Time interval at which to perform the most granular calculations.
Recommended value: 1 hour.
Data
requirement
For each arriving flight:
- Actual landing time (ALDT)
For each time interval:
- Declared landing capacity of the airport
Calculation
procedure
For each time interval:
1. Compute the throughput: count the number of actual landings based on
ALDT
2. Compute the utilization = throughput / capacity
At the level of an individual airport:
3. Compute the KPI: sum(utilization* capacity) / sum(capacity)
References
CANSO Recommended KPIs for Measuring ANSP Operational
Performance (2015)
2016–2030 Global Air Navigation Plan(Doc 9750-AN/963 Fifth Edition
– 2016)
Airspace management Handbook Version 2.2 December 2005
KPI Name
Airport departure capacity utilization
ID
KPI05
Definition
Airport departure throughput compared to departure capacity. The
departure capacity refer to the declared capacity at present, in later stages,
it could be replaced by dynamic capacity.
KPI should be strongly recommended if the airport runs near capacity.
Measurement
Units
Percentage (%)
Variants
None
Parameters
Time interval at which to perform the most granular calculations.
Recommended value: 1 hour.
Data
requirement
For each arriving flight:
- Actual take-off time (ATOT)
For each time interval:
- Declared take-off capacity of the airport
Calculation
procedure
For each time interval:
1. Compute the throughput: count the number of actual take-offs based on
ATOT
2. Compute the utilization = throughput / capacity
At the level of an individual airport:
3. Compute the KPI: sum(utilization* capacity) / sum(capacity)

Asia-Pacific Air Traffic Management Performance Measurement Framework V1.0
22
References
CANSO Recommended KPIs for Measuring ANSP Operational
Performance (2015)
2016–2030 Global Air Navigation Plan(Doc 9750-AN/963 Fifth Edition
– 2016)
Airspace management Handbook Version 2.2 December 2005
Efficiency – Additional Flight Time
4.3 Those KPIs are intended to give an indication of the efficiency of each flight phase
operations on the surface or en-route.
KPI Name
Additional runway-to-runway time
ID
KPI08
Definition
Actual runway-to-runway time compared to an unimpeded/reference
operation time.
Measurement
Units
Minutes/flight
Variants
Variant 1 – basic (computed without take-off and landing airport )
Variant 1 – advanced (computed with take-off and landing airport )
Parameters
Unimpeded/reference runway-to-runway time:
- Recommended approach for the KPI: a value from a single-flight
perspective, e.g. the 20th percentile of actual operation times recorded at
airlines which have the same route, sorted from the shortest to the
longest
Data
requirement
For each departing scheduled flight:
- Location indicator for take-off airport
- Actual take-off time (ATOT)
For each arriving scheduled flight:
- Location indicator for landing airport
- Actual landing time (ALDT)
Calculation
procedure
At the level of individual flights:
1. Select the flights, exclude those with departure and arrival airport out
of the region or specific states.
2. Compute actual duration: ALDT minus ATOT
3. Compute additional flight time: actual duration minus unimpeded
flight time
At aggregated level:
1. Compute the KPI: sum of additional flight times divided by number
of IFR flights
References
None
Notes: The calculation of the additional operation time needs to consider the influence of
performance evaluation from different statistical periods. For example, the performance
evaluation by month should reflect the seasonal impact more efficiently, and may focus
on running characteristics of the flow both in peak and normal period by hour. However,
considering the transmission standard and methods haven’t been united, if just handing
in the results of calculation, it should be uploaded by month to show the seasonal
influence.
4.4 KPI09 Additional taxi-in time (refer to Efficiency)
4.5 KPI10 Additional taxi-out time (refer to Efficiency)

Asia-Pacific Air Traffic Management Performance Measurement Framework V1.0
23
KPI Name
Additional terminal area arrival flight time
ID
KPI12
Definition
Actual terminal arrival time compared to a unimpeded time [avg. per
airport or per cluster of airports]
Measurement
Units
Minutes/flight
Variants
Variants are possible depending on the chosen size of terminal airspace
(40 NM or 100 NM cylinder) and the richness of the data feed: basic
(without arrival runway ID) or advanced (with arrival runway ID)
Variants with 100 NM cylinder are useful if airports have holding
patterns outside the 40 NM cylinder
The use of generic cylinders abstracts local specifics in terms of
approach airspace design (e.g. TMA) and ensures comparability across
different airports.
Parameters
Unimpeded terminal area arrival flight time:
- Recommended approach for the basic variants of the KPI: a single
value at airport level = the 20
th
percentile of actual terminal airspace
arrival times recorded at an airport, sorted from the shortest to the
longest
- Recommended approach for the advanced variants of the KPI: a
separate value for each entry segment/landing runway combination = the
20
th
percentile of actual terminal airspace arrival times recorded.
during
periods of non-congestion (needs to be periodically reassessed)
Data
requirement
For each arriving flight:
- Terminal airspace entry time, computed from surveillance data (radar,
ADS-B…)
- Actual landing time (ALDT)
In addition for the advanced KPI variants:
- Terminal airspace entry segment, computed from surveillance data
(radar, ADS-B…)
- Landing runway ID
Calculation
procedure
At the level of individual flights:
1. Select arrivals, exclude helicopters
2. Compute actual terminal airspace transit time: ALDT minus terminal
airspace entry time
3. Compute additional terminal airspace transit time: actual terminal
airspace transit time minus unimpeded terminal airspace transit time
At aggregated level:
4. Compute the KPI: sum of additional terminal airspace transit times
divided by number of IFR arrivals
References
Comparison of ATM-Related Operational Performance: U.S./Europe
(June 2014)
PRC Performance Review Report (EUROCONTROL 2015)
Single European Sky Performance Scheme
CANSO Recommended KPIs for Measuring ANSP Operational
Performance (2015)
2016-2030 Global Air Navigation Plan(Doc 9750-AN/963 Fifth Edition-
2016)
Notes: In order to stress the seasonal influences, data should be uploaded monthly refer
to the statistical period of the additional runway-to-runway time.

Asia-Pacific Air Traffic Management Performance Measurement Framework V1.0
24
Flow
4.6 KPI20 Airport arrival throughput (refer to Cost Efficiency)
4.7 KPI21 Flight departure punctuality (refer to Cost Efficiency)
Predictability – Flight Time
4.8 KPI22 Flight arrival punctuality (refer to Predictability)
4.9 KPI23 Flight departure punctuality (refer to Predictability)
Capacity utilization
4.10 KPI04 Airport arrival capacity utilization (refer to Capacity)
4.11 KPI05 Airport departure capacity utilization (refer to Capacity)
KPI Name
Flight time variability
ID
KPI34
Definition
Distribution of the flight (phase) duration around the average value
Measurement
Units
Minutes/flight
Variants
None
Parameters
Minimum monthly flight frequency filter: flights with a frequency less
than 20 times per month are not included in the indicator.
70% of the (remaining) flights are considered in the indicator, i.e. the
15th percentile (percentile 1) is used to determine the shortest
duration, the 85
th
percentile (percentile 2) is used to determine the
longest duration, and the remaining parts is used to calculate average
duration.
Data requirement
For each flight:
- Actual off-block time (AOBT)
- Actual take-off time (ATOT)
- Terminal airspace depart time
- Terminal airspace entry time
- Actual landing time (ALDT)
- Actual in-block time (AIBT)
Calculation
Procedure
1. Exclude flights with frequency less than 20 times per month
At the level of individual flights:
2. Compute the flight time of certain flight phase
At aggregated level:
3. Sort the flight time from the shortest to the longest to form a flights
time sequence
4. Choose values from percentile 15th to 85th of the flight time
sequence to compute the average flight duration
For each flight:
5. Compute the KPI: Variance of total flight time based on the average
flight duration
Reference
Comparison of ATM-Related Operational Performance: U.S./Europe
(June 2014)
PRC Performance Review Report (EUROCONTROL 2015)
CANSO Recommended KPIs for Measuring ANSP Operational
Performance (2015)

Asia-Pacific Air Traffic Management Performance Measurement Framework V1.0
25
Environment
4.12 All indicators will be introduced in following stages.
Cost-efficiency – Immediate Outputs
4.13 KPI03 En-route airspace capacity (refer to Capacity)
Cost-efficiency –Outputs
4.14 KPI20 Airport arrival throughput (refer to Efficiency)
4.15 KPI21 Airport departure throughput (refer to Efficiency)

Asia-Pacific Air Traffic Management Performance Measurement Framework V1.0
26
KPI FRAMEWORK – THIRD STAGE
Key Performance Indicators Framework in the Third Implementation Stage
5.1 The third implement stage needs unified identification of flight phase and a certain number
of data storage during the stages before. And this stage may require to use some technique& equipment.
ID
KPIs
Leve
l
KPAs
KPI04
Airport arrival capacity utilization
SR
Capacity, Predictability
KPI05
Airport departure capacity utilization
SR
Capacity, Predictability
KPI06
En-route sector capacity utilization
R
Capacity, Predictability
KPI08
Additional en-route flight time
R
Efficiency
KPI11
Additional runway occupation time
R
Efficiency
KPI15
En-route airspace ATFM delay
R
Efficiency
KPI16
Airport/Terminal ATFM delay
R
Efficiency
KPI17
Delay on board
R
Efficiency
KPI18
Filed flight plan en-route extension rate
R
Efficiency, Predictability
KPI19
Actual en-route extension rate
R
Efficiency, Environment
KPI25
Flight plan variation
R
Predictability
KPI27
Additional fuel burn
R
Environment
KPI28
ANSP’s Cost of Per IFR hours
R
Cost-efficiency
Table 4: KPIs in Stage 3
Capacity
5.2 KPI04 Airport arrival capacity utilization (Refer to 3.2.1)
5.3 KPI05 Airport departure capacity utilization (Refer to 3.2.1)
KPI Name
En-route sector capacity utilization
ID
KPI06
Definition
Actual airspace throughput compared to the declared airspace capacity.
Measurement
Units
Percentage (%)
Variants
None
Parameters
Time interval at which to perform the most granular calculations.
Recommended value: 15 minutes.
Data
requirement
Declared capacities are determined by the ANSP, and are dependent on
traffic pattern and sector configuration.
Calculation
procedure
For each time interval:
1. Compute the throughput: count the number of actual flights based on
ANSPs
2. Compute the utilization = throughput / capacity
At aggregated level (longer time periods):
3. Compute the KPI: sum(utilization* capacity) / sum(capacity)
References
CANSO Recommended KPIs for Measuring ANSP Operational
Performance (2015)
2016–2030 Global Air Navigation Plan(Doc 9750-AN/963 Fifth Edition
– 2016)

Asia-Pacific Air Traffic Management Performance Measurement Framework V1.0
27
Efficiency - Additional Flight Time
KPI Name
Additional en-route flight time
ID
KPI08
Definition
Actual en-route time flown compared to a unimpeded time
Measurement
Units
Minutes/flight
Variants
None
Parameters
Unimpeded/reference en-route flight time:
- Recommended approach for the the KPI: a value from a single-flight
perspective, e.g. the 20th percentile of actual en-route flight times
recorded at airlines have similar routes, sorted from the shortest to the
longest
Data
requirement
For each IFR flight with same terminal fix:
- En-route airspace entry time
- En-route airspace exit time
- Airspace volume associated with the flow restriction
Calculation
procedure
At the level of individual flights:
1. Select the flights crossing the volume of en-route airspace, exclude
helicopters
2. Compute actual crossing duration: airspace exit time –airspace entry
time
3. Compute additional en-route flight time: actual en-route airspace
flight time minus unimpeded en-route airspace flight time
At aggregated level:
4. Compute the KPI: sum of additional en-route flight time divided by
number of IFR flights
References
PRC Performance Review Report (EUROCONTROL 2015)
Notes: In order to stress the seasonal influences, data should be uploaded monthly refer
to the statistical period of the additional runway-to-runway time.
KPI Name
Additional runway occupation time
ID
KPI11
Definition
Actual runway occupation time compared to a unimpeded time [avg. per
airport or per cluster of airports]
Measurement
Units
Minutes/flight
Variants
Variant 1 – basic (computed without landing or departure runway data)
Variant 2 – advanced (computed with landing or departure runway data)
Parameters
Unimpeded/reference runway occupation time:
- Recommended approach for the KPI: a single value at airport level,
e.g. the 20th percentile of actual runway occupation recorded at an
airport, sorted from the shortest to the longest
Data
requirement
For each landing flight:
- Actual landing time (ALDT)
- The time leaving the runway
For each departing flight:
- Actual take-off time (ATOT)
- The time entering the runway
In addition for the advanced KPI variant:
- Landing runway ID
- Take-off runway ID
Calculation
procedure
- At the level of individual flights
1. Select arrival flights, exclude helicopters

Asia-Pacific Air Traffic Management Performance Measurement Framework V1.0
28
2. Compute actual duration: the time leaving the runway minus ALDT
3. Compute additional runway occupation time: actual duration minus
unimpeded runway occupation time
4. Select departing flights, exclude helicopters
5. Compute additional runway occupation time: ATOT minus the time
entering the runway
6. Compute additional runway occupation time: actual duration minus
unimpeded runway occupation time
- At aggregated level:
7. Compute the KPI: sum of additional runway occupation times divided
by number of IFR departures
References
None
Notes: In order to stress the seasonal impacts, data should be uploaded monthly refer to
the statistical period of the additional runway-to-runway time.
Delay
KPI Name
En-route airspace ATFM delay
ID
KPI15
Definition
ATFM delay attributed to flow restrictions in a given airspace volume.
Delay means the different between estimated and actual time.
Measurement
Units
Minutes/flight
Variants
Variant 1: calculated with all flights.
Variant 2 calculated with delayed flights.
Parameters
None
Data
requirement
For each IFR flight:
- Schedule Time of departure (STD)
- Actual Off-block Time (AOBT)
- ID of the flow restriction generating the ATFM delay
- Airspace volume associated with the flow restriction
- Delay code associated with the flow restriction
Calculation
Procedure
At the level of individual flights:
1.Select delayed flights attributed to flow restrictions in a given airspace
volume
2.Compute en-route ATFM delay: AOBT minus STD
At aggregated level:
3.Compute the KPI: sum of en-route ATFM delays divided by number
of flights(all flights for Variant 1 or delayed flights for Variant 2)
References
ICAO EUR Doc 030 EUR Region Performance Framework Document
(July 2013)
PRC Performance Review Report (EUROCONTROL 2015)
Single European Sky Performance Scheme
CANSO Recommended KPIs for Measuring ANSP Operational
Performance (2015)
2016-2030 Global Air Navigation Plan(Doc 9750-AN/963 Fifth
Edition-2016)
Notes: Similarly, KPIs of delay will show different statistical characteristics in distinct
uploading or statistical periods. If just handing in the results of calculation, it would be
better to upload the data by month to show the seasonal influence.

Asia-Pacific Air Traffic Management Performance Measurement Framework V1.0
29
KPI Name
Airport/Terminal ATFM delay
ID
KPI16
Definition
ATFM delay attributed to arrival flow restrictions at a given
airport and/or associated terminal airspace volume. Delay means the
different between estimated and actual time.
Measurement
Units
Minutes/flight
Variants
Variant 1: calculated with all flights.
Variant 2 calculated with delayed flights.
Parameters
None
Data
requirement
For each IFR flight:
- Schedule Time of Arrival (STA)
- Actual In-block Time (AIBT)
- ID of the flow restriction generating the ATFM delay
- Airport/terminal volume associated with the flow restriction
- Delay code associated with the flow restriction
Calculation
Procedure
At the level of individual flights:
1.Select delayed flights attributed to arrival flow restrictions at a given
airport and/or associated terminal airspace volume.
2.Compute airport/terminal ATFM delay: AIBT minus STA
At aggregated level:
3.Compute the KPI: sum of airport/terminal ATFM delays divided by
number of flights(all flights for Variant 1 or delayed flights for Variant
2)
References
ICAO EUR Doc 030 EUR Region Performance Framework Document
(July 2013)
PRC Performance Review Report (EUROCONTROL 2015)
Single European Sky Performance Scheme
CANSO Recommended KPIs for Measuring ANSP Operational
Performance (2015)
2016-2030 Global Air Navigation Plan(Doc 9750-AN/963 Fifth
Edition-2016)
Notes: Similarly, KPIs of delay will show different statistical characteristics in distinct
uploading or statistical periods. If just handing in the results of calculation, it would be
better to upload the data by month to show the seasonal influence.
KPI Name
Delay on board
ID
KPI17
Definition
Time range between take-off(landing) and boarding-completed
(disembarking-completed) exceeds the specified taxing time.
[avg. per airport or per cluster of airports]
Measurement
Units
Minutes/flight
Variants
Variant 1 – basic (computed without take-off/landing runway ID )
Variant 2 – advanced (computed with take-off/landing runway ID )
Parameters
None
Data
requirement
For each departing flight:
- Actual take-off time (ATOT)
- Actual boarding completed time
- Specified taxing time
For each arriving flight:
- Actual landing time (ALDT)
- Actual disembarking completed time

Asia-Pacific Air Traffic Management Performance Measurement Framework V1.0
30
- Specified taxing time
In addition for the advanced KPI variants:
- Take-off runway ID
Calculation
Procedure
For Variant 1:
At the level of individual flights:
1.Select departure flights.
2.Compute departure onboard time: ATOT minus actual boarding
completed time.
3. Compute departure onboard delay: departure onboard time minus
specified taxing time.
4. Select arrival flights
5. Compute arrival onboard time: Actual disembarking completed time
minus ALDT.
6. Compute arrival onboard delay: arrival onboard time minus specified
taxing time
At aggregated level:
7. Compute the KPI: sum of arrival delays divided by number of arrivals
or sum of departure delays divided by number of departures
For Variant 2:
1.Select departure flights using specified runway.
2.Compute departure onboard time: ATOT minus actual boarding
completed time.
3. Compute departure onboard delay: departure onboard time minus
specified taxing time.
4. Select arrival flights using specified runway.
5. Compute arrival onboard time: Actual disembarking completed time
minus ALDT.
6. Compute arrival onboard delay: arrival onboard time minus specified
taxing time
At aggregated level:
7. Compute the KPI: sum of arrival delays divided by number of arrivals
or sum of departure delays divided by number of departures
References
Normal flight management method (2016)
Level flight efficiency
5.4 Those KPIs measures the en-route horizontal flight (in) efficiency contained in a set of
filed flight plans or actual flight trace crossing an airspace volume. Its value is influenced by route
network design, route & airspace availability, airspace user choice (e.g. to ensure safety, to minimize
cost and to take into account wind and weather) and airspace user constraints (e.g. overflight permits,
aircraft limitations).
KPI Name
Filed flight plan en-route extension rate
ID
KPI18
Definition
Flied flight planned en-route distance compared to a reference ideal
distance
Measurement
Units
Percentage(%)
Variants
Variant 1: Filed flight plan en-route extension rate under the influence
of en-route condition.
Variant 2: Filed flight plan en-route extension rate under the influence

Asia-Pacific Air Traffic Management Performance Measurement Framework V1.0
31
of terminal area condition.
Parameters
Departure terminal area proxy: a cylinder with 40 NM radius around the
departure airport.
Destination terminal area proxy: a cylinder with 100 NM radius around
the destination airport
Data
requirement
For each flight plan:
- Departure airport (Point A)
- Destination airport (Point B)
- Exit point of the Departure terminal area proxy (Point C)
- Entry points of the Destination terminal area proxy (Points D)
- Planned distance for each AB portion of the flight
Calculation
Procedure
Detailed calculation procedure is shown in the third appendix. However,
flights with starting and destination points out of the range should be
excluded.
Reference
ICAO EUR Doc 030 EUR Region Performance Framework Document
(July 2013)
Comparison of ATM-Related Operational Performance: U.S./Europe
(June 2014)
PRC Performance Review Report (EUROCONTROL 2015)
Single European Sky Performance Scheme
CANSO Recommended KPIs for Measuring ANSP Operational
Performance (2015)
2016-2030 Global Air Navigation Plan(Doc 9750-AN/963 Fifth Edition-
2016)
Notes: The calculation of the level flight efficiency needs to consider the influence of
performance evaluation from different statistical periods. For example, the performance
evaluation by month should reflect the seasonal impact more efficiently, and may focus
on running characteristics of the flow both in peak and normal period by hour. However,
considering the transmission standard and methods haven’t been united, if just handing
in the results of calculation, it should be uploaded by month to show the seasonal
influence.
KPI Name
Actual en-route extension rate
ID
KPI19
Definition
Actual en-route distance flown compared to a reference ideal distance
Measurement
Units
Percentage(%)
Variants
Variant 1: Actual en-route extension rate under the influence of en-route
condition.
Variant 2: Actual en-route extension rate under the influence of terminal
area condition.
Parameters
Departure terminal area proxy: a cylinder with 40 NM radius around the
departure airport.
Destination terminal area proxy: a cylinder with 100 NM radius around
the destination airport.
Data
requirement
For each actual flight trajectory:
- Departure airport (Point A)
- Destination airport (Point B)
- Exit point of the Departure terminal area proxy (Point C)
- Entry points of the Destination terminal area proxy (Points D)
- Distance flown for each NX portion of the actual flight trajectory,
derived from surveillance data (radar, ADS-B…).
Calculation
Procedure
Identical to the formula/algorithm of the ‘Filed Flight Plan en-Route
Extension Rate’ KPI.

Asia-Pacific Air Traffic Management Performance Measurement Framework V1.0
32
Reference
ICAO EUR Doc 030 EUR Region Performance Framework Document
(July 2013)
Comparison of ATM-Related Operational Performance: U.S./Europe
(June 2014)
PRC Performance Review Report (EUROCONTROL 2015)
Single European Sky Performance Scheme
CANSO Recommended KPIs for Measuring ANSP Operational
Performance (2015)
2016-2030 Global Air Navigation Plan(Doc 9750-AN/963 Fifth
Edition-2016)
Notes: The calculation of the level flight efficiency needs to consider the influence of
performance evaluation from different statistical periods. For example, the performance
evaluation by month should reflect the seasonal impact more efficiently, and may focus
on running characteristics of the flow both in peak and normal period by hour. However,
considering the transmission standard and methods haven’t been united, if just handing
in the results of calculation, it should be uploaded by month to show the seasonal
influence.
Predictability – Flight Time
KPI Name
Flight plan variation
ID
KPI25
Definition
Difference between the 85th and 15th percentile flight plan distance or
time for a city pair.
Measurement
Units
Kilometers or minutes
Variants
Variant 1 – flight time
Variant 2 – flight distance
Parameters
None
Data
requirement
For each departing flight:
-Planed flight distance and time for certain city pairs.
Calculation
Procedure
For variant 1:
For each flight’s flight plan in certain city pair:
1. Select all the flight plan belong to one flight.
2. Order those flight time from biggest to smallest.
3. Compute the variation= 85
th
flight time minus 15
th
flight time.
At aggregated level:
1.Compute the KPI: sum of variations divided by number of flights.
For variant 2:
For each flight’s flight plan in certain city pair:
1. Select all the flight plan belong to one flight.
2. Order those flight distance from biggest to smallest.
3. Compute the variation= 85
th
flight distance minus 15
th
flight distance.
At aggregated level:
1.Compute the KPI: sum of variations divided by number of flights.
References
CANSO Recommended KPIs for Measuring ANSP Operational
Performance (2015)
Flight distance
5.5 KPI18 Filed flight plan en-route extension rate (refer to Efficiency).
Environment – Indirect Environmental Influence

Asia-Pacific Air Traffic Management Performance Measurement Framework V1.0
33
5.6 KPI19 Actual en-route extension rate (refer to Efficiency).
KPI Name
Additional fuel burn
ID
KPI27
Definition
The full extent of fuel combustion.
Measurement
Units
kg fuel/flight
Variants
None
Parameters
Average fuel flow (kg/min) during taxi
Average fuel flow (kg/min) during arrival in terminal airspace
Average fuel flow (kg/km) in en-route airspace
Data requirement
Indicator values to be converted to estimated additional fuel burn:
Additional Taxi-Out Time (min/flight)
Additional Taxi-In Time (min/flight)
Actual en-Route Extension (km/flight)
Additional time in terminal airspace (min/flight)
Calculation
procedure
Compute the KPI: sum of average fuel flow * addition operation time
of different flight phases(i.e. taxi-out, taxi-in, en-route, and terminal
airspace)
Reference
Comparison of ATM-Related Operational Performance: U.S./Europe
(June 2014)
Cost-efficiency - Outputs
KPI Name
ANSP’s Cost of Per IFR hour
ID
KPI28
Definition
Actual ANSP’s cost of per IFR hour
Measurement
Units
$/hour
Variants
None
Parameters
Costs
IFR hours
Calculation
procedure
Compute the KPI:
The Costs consists of ATCOs in OPS costs and other costs.
ATCOs in OPS costs is composed of ‘ATCOs in OPS employment
cost per ATCO hour’ (
)
and ‘ATCOs in OPS hour productivity’
(
).
Data requirement
For each ANSP:
ATCOs in OPS costs
Other costs, including frontline staff costs, ATCOs in non-OPS,
remaining employment costs, remaining operational costs,
depreciation costs, capital costs, etc
IFR hours
For each country:
ATCOs in OPS costs of the country
Other costs of the country
IFR hours of the corresponding country
Reference
CANSO Global Air Navigation Services Performance Report 2016
(2011-2015 ANSP Performance Results Executive Summary)

Asia-Pacific Air Traffic Management Performance Measurement Framework V1.0
34
KEY PERFORMANCE INDICATORS FOR SAFETY
6.1 For safety performance metrics, there is a specific working group to study and promote the
performance indicators. In the construction of the framework, safety is taken as an individual section
which will not be focused on, although relevant indicators are still provided suggestion for reference.
The specific indicators for safety are shown below.
ID
KPIs
Stage1
Stage2
Stage3
KPI36
Rate of flights under safety control
R
1
KPI37
Growth rate of safety level
R
2
KPI38
Rate of various types of aircraft accidents
R
1
KPI39
Rate of aircraft incidents and errors
R
1
KPI40
Rate of aircraft surface accidents
R
2
KPI41
Rate of airspace infringements
R
2
Table 5: KPIs for Safety
Statistics of Safety Operation
KPI Name
Rate of flights under safety control
ID
KPI36
Definition
This KPI measures the rate of flights encountering no occurrences
associated with the operation of an aircraft which take place between the
time any person boards the aircraft with the intention of flight until all
such persons have disembarked, where a person is fatally or seriously
injured, the aircraft sustains damage or structural failure or the aircraft is
missing or is completely inaccessible under the protection and
supervision of ATC, airline and so on.
Measurement
Units
Percentage(%)
Variants
Variant 1 – number of flights (computed by number of flights)
Variant 2 – flight time (computed by flight time of flights)
Parameters
Statistical Period
Recommended value: 1 month or calendar quarter.
Data
requirement
Number of safety controlled flights.
Number of controlled flights.
Calculation
procedure
1. Get total number of flights in such area.
2. Select and get number of the flights under safety control in the same
statistical range of step1.
3. Compute the KPI: number of safety flight divide total number of
flights.
References
None
KPI Name
Growth rate of safety level
ID
KPI37
Definition
This KPI measures the rate of change on increasing level of safety in
given time
Measurement
Units
Percentage(%)
Variants
Variant 1 – number of flights (computed by number of flights)
Variant 2 – flight time (computed by flight time of flights)
Parameters
Statistical Period:

Asia-Pacific Air Traffic Management Performance Measurement Framework V1.0
35
Recommended value: 1 year.
Data
requirement
Rate of flights under safety control
Calculation
procedure
1. Get Rate of flights under safety control in such area both a year and a
month.
2a. Compute the year-on-year KPI: growth rate= rate of flights under
safety control of this year/ rate of flights under safety control last year
2b. Compute the month-on-month KPI: growth rate= rate of flights under
safety control of this month/ rate of flights under safety control of this
month last year
References
None
Aircraft Unsafe Incidents
KPI Name
Rate of various types of aircraft accidents
ID
KPI38
Definition
The rate of occurrences associated with the operation of an aircraft,
which take place between the time any person boards the aircraft with the
intention of flight until all such persons have disembarked, where a
person is fatally or seriously injured, the aircraft sustains damage or
structural failure or the aircraft is missing or is completely inaccessible.
Measurement
Units
Percentage(%)
Variants
Variant 1 –extremely large accidents
Variant 2 –serious accidents
Variant 3–accidents
Parameters
Statistical Period
Recommended value: 1 year.
Data
requirement
Number of controlled flights.
For variant 1:
Number of extremely large accidents.
For variant 2:
Number of serious accidents.
For variant 3:
Number of accidents.
Calculation
procedure
1. Get total number of flights in such area.
2. Select and get number of the flights suffer different kinds of accidents
in the same statistical range of step1.
For variant 1:
3a. Compute the KPI: number of flights suffer extremely large accidents
divide total number of flights.
For variant 2:
3b. Compute the KPI: number of flights suffer serious accidents divide
total number of flights.
For variant 3:
3c. Compute the KPI: number of flights accidents divide total number of
flights.
References
PRC Performance Review Report (EUROCONTROL 2015)

Asia-Pacific Air Traffic Management Performance Measurement Framework V1.0
36
KPI Name
Rate of aircraft incidents and errors
ID
KPI39
Definition
Rate of flight incidents and errors .Aircraft incident is an occurrence,
other than an accident, associated with the operation of an aircraft which
affects or could affect the safety of operation; Error averages that
something has been done that was not intended by the actor; not desired
by a set of rules or an external observer; or that led the task or system
outside its acceptable limits. In short, it is a deviation from intention,
expectation or desirability.
Measurement
Units
Percentage(%)
Variants
Variant 1 –incidents
Variant 2 –errors
Parameters
Statistical Period
Recommended value: 1 year.
Data
requirement
Number of controlled flights.
For variant 1:
Number of flight incidents.
For variant 2:
Number of flight errors.
Calculation
procedure
1. Get total number of flights in such area.
2. Select and get number of the flights suffer incidents and errors in the
same statistical range of step1.
For variant 1:
3a. Compute the KPI: number of flights suffer incidents divide total
number of flights.
For variant 2:
3b. Compute the KPI: number of flights suffer flight errors divide total
number of flights.
References
PRC Performance Review Report (EUROCONTROL 2015)
Aircraft Accidents and Incidents
KPI Name
Rate of aircraft surface accidents
ID
KPI40
Definition
This KPI is the rate of aircraft accidents and incidents occur on the
ground(including runway, taxiway and apron)
Measurement
Units
Percentage(%)
Variants
None
Parameters
Statistical Period
Recommended value: 1 year.
Data requirement
Number of controlled flights.
Number of flights suffer surface accidents.
Calculation
procedure
1. Get total number of flights in such area.
2. Select and get number of the flights suffer surface accidents in the
same statistical range of step1.
3. Compute the KPI: number of flights suffer surface accidents divide
total number of flights.
References
EUROCONTROL. Cognitive Complexity in Air Traffic Control: A
Literature Review, 2004.

Asia-Pacific Air Traffic Management Performance Measurement Framework V1.0
37
KPI Name
Rate of aircraft airspace infringements
ID
KPI41
Definition
Rate of a flight into a notified airspace that has not been subject to
approval by the designated controlling authority of that airspace in
accordance with international and national regulations.
Measurement
Units
Percentage(%)
Variants
None
Parameters
Statistical Period
Recommended value: 1 year.
Data requirement
Number of controlled flights.
Number of flights cause airspace infringements.
Calculation
procedure
1. Get total number of flights in such area.
2. Select and get number of the flights cause airspace infringement in
the same statistical range of step1.
3. Compute the KPI: number of flights cause airspace infringement
divide total number of flights.
References
PRC Performance Review Report (EUROCONTROL 2015)

Asia-Pacific Air Traffic Management Performance Measurement Framework V1.0
38
Step-By-Step Performance-Based Approach
Introduction
7.1 The performance-based approach is a way of organizing the performance management
process. This approach can be broken down into manageable, easy-to-understand steps. By
systematically following these steps, ATM community members will gain confidence in their ability
to apply the approach in a successful manner, and benefit from participating in a globally harmonized
approach.
7.2 Figure 6: outlines the general sequence of steps in the performance management process.
It serves as general guidance.
1.
Define/review
scope, context and
general ambitions
and expectations
2.
Identify
opportunities, issues
and set (new) objectives
3.
Quantify
objectives
4.
Select solutions to
exploit opportunities
and resolve issues
5.
Implement
solutions
6.
Assess
achievement
of objectives
Figure 6: General Performance Management Process
7.3 The steps cover the following activities:
Step 1: Define/review scope, context and general ambitions/expectations.
Step 1.1: Define scope;
Step 1.2: Define context;
Step 1.3: Identify ambitions and expectations.
Step 2: Identify opportunities, issues and set (new) objectives.
Step 2.1: Develop a list of present and future opportunities and issues that require
performance management attention;
Step 2.2: Focus efforts by defining and prioritizing performance objectives as
needed.

Asia-Pacific Air Traffic Management Performance Measurement Framework V1.0
39
Step 3: Quantify objectives.
Step 3.1: Define how progress in achieving performance objectives will be
measured and which data are required to do so;
Step 3.2: Define the desired speed of progress in terms of baseline and target
performance.
Step 4: Select solutions to exploit opportunities and resolve issues.
Step 4.1: Select the decisive factors to reach the target performance;
Step 4.2: Identify solutions to exploit opportunities and mitigate the effects of
the selected drivers and blocking factors;
Step 4.3: Select a sufficient set of solutions.
Step 5: Implement solutions.
Step 6: Assess achievement of objectives.
Step 1: Define/Review Scope, Context and General Ambitions/Expectations
7.4 The purpose of Step 1 is to reach a common agreement on the scope and (assumed)
context of the “system” on which the performance management process will be applied, as well as a
common view on the general nature of the expected performance improvements.
Step 1.1: Define Scope
7.5 There is not just one global application of the performance management process, but
many simultaneous — and often interrelated — applications at more specialized and localized levels.
Scope definition is important to avoid misunderstandings, in particular about the performance
(improvement) which can be expected within the given scope. For example, the possibilities for
managing safety or environmental impact vary depending on whether one considers only the role of
ATM or approaches the subject at the level of the entire air transport system. By defining the scope of
the performance management activity, the limits of responsibility and accountability are also defined.
Step 1.2: Define Context
7.6 Once the scope is defined, it is necessary to make clear assumptions on what is
“surrounding” the performance management activity. This includes clarifying what the strategic fit is
within a larger (parent scope) performance management activity, with whom there is a need to
coordinate and collaborate, and what the external drivers and constraints are for the scope.
Step 1.3: Identify Ambitions and Expectations
7.7 Within a given scope, the purpose of identifying general ambitions and expectations is to
develop a strategic view on the (performance) results that are expected. The term “expectation” refers
to desired results from an external perspective. The term “ambition” indicates that the desired results
refer to an internal initiative. For example, in ATM, the performance-based approach can be used to
better meet society’s aviation expectations, as well as improve the business performance of airlines,
service providers, etc. To achieve this, identify ambitions and expectations with regard to the
performance of flight operations, airspace/airport usage and air navigation services in areas such as:
a) safety;
b) security;
c) environmental impact;
d) cost effectiveness;

Asia-Pacific Air Traffic Management Performance Measurement Framework V1.0
40
e) capacity;
f) flight efficiency;
g) flexibility;
h) predictability;
i) access and equity;
j) participation and collaboration; and
k) interoperability.
7.8 These are the eleven key performance areas (KPAs) as identified in the Global Air
Traffic Management Operational Concept (Doc 9854). Achievable performance is made possible by
the following enabler levels:
a) services and procedures;
b) human resources;
c) physical infrastructure;
d) systems and technology; and
e) regulation and standardization.
7.9 The performance-based approach (PBA) can be applied at each of these enabler levels
for the purposes of understanding the impact on the eleven KPAs. For example, for the systems and
technology level, the focus includes technical performance characteristics such as service/system
availability, continuity, reliability, integrity, resilience, maintainability, scalability etc. An important
part of the PBA is the development of cause-effect relationships between these technical performance
characteristics and the higher level 11 KPAs.
Step 2: Identify Opportunities, Issues and Set (New) Objectives
7.10 The purpose of Step 2 is to develop a detailed understanding of the performance behavior
of the system (this includes producing a list of opportunities and issues), and to decide which specific
performance aspects are essential for meeting the general expectations. The essential performance
aspects are those which need to be actively managed (and perhaps improved) by setting performance
objectives.
7.11 Step 2.1: Develop a list of present and future opportunities and issues that require
performance management attention. Based on the scope, context and general ambitions/expectations
which were agreed to during the previous step, the system should be analyzed in order to develop an
inventory of present and future opportunities and issues (weaknesses, threats) that may require
performance management attention. This part of the process is generally known as the SWOT
(strengths, weaknesses, opportunities and threats) analysis. Strengths are (internal) attributes of a
system or an organization that help in the realization of ambitions or in meeting expectations.
Weaknesses are (internal) attributes of a system or an organization that are a detriment to realizing
ambitions or meeting expectations. Opportunities are external conditions that help in the realization of
ambitions or in meeting expectations. Threats are external conditions that are a detriment or harmful
to realizing ambitions or meeting expectations.
7.12 Note that what may represent strengths with respect to one ambition or expectation may
be weaknesses for another one. The term “issues” is used in this document to refer to weaknesses as
well as threats. A good understanding of the opportunities and issues should be developed early in the
process, to provide background information for deciding which performance objectives to set, what to
measure and how/where to change the system. When possible (second or later iteration in the
process), advantage should be taken of the results of Step 6: Assess achievement of objectives. In

Asia-Pacific Air Traffic Management Performance Measurement Framework V1.0
41
general, this activity should take place as part of the forecasting and performance review.
7.13 Once the strengths, weaknesses, opportunities and threats are identified, action can be
taken to target and exploit or remove these factors, thereby leading to performance improvements
directly related to meeting the expectations.
Step 2.2: Focus efforts by defining and prioritizing performance objectives as needed
7.14 The purpose of this activity is to focus and prioritize the application of the performance-
based approach:
a) Focus is necessary to aim general expectations into specific performance objectives,
which in turn will be the basis for deciding on improvement actions.
b) Prioritization is required because, even though the scope of the process has already
been limited, in practice, not everything can and/or needs to be performance managed.
c) Prioritization is supported by risk management which helps identify the risks that are
most urgent or must be avoided, those that should be transferred or reduced, and those
that are reasonable to retain.
7.15 Focusing the performance-based approach is a two-stage process:
a) Within each KPA, identify a number of specific areas — focus areas — in which
there are potential intentions to establish performance management. Focus areas are
typically needed where issues have been identified (see Step 2.1). For example,
within the capacity KPA one can identify airport capacity, runway capacity and apron
capacity as focus areas. Within the safety KPA, the list of focus areas might include:
accidents, incidents, runway incursions, safety management system maturity, etc.
There may be a need to define hierarchical groupings of focus areas; and
b) Within focus areas, the potential intention to establish performance management is
“activated” by defining one or more performance objectives. These define a desired
trend in a qualitative and focused way in today’s performance; they specifically focus
on what has to be achieved, but do not make statements about the when, where, who
or how much. These objectives may be developed iteratively with the development
of indicators. Significant analysis of historical data, performance modeling or
simulation may be required to understand the necessary objectives. For example,
“improve safety” is not specific enough to be an objective, but represents a starting
point. Further analysis would reveal that “reduce the total number of accidents” and
even more specifically “reduce the number of CFIT accidents” would qualify as
performance objectives. Because at this level of detail no mention is made about the
when, where and who, it does not make sense to try to associate numbers (indicator
values or targets) at this level. That is done during the next step of the process.
7.16 Prioritizing the performance-based approach averages that performance objectives will
only be defined in those focus areas where a real (present or anticipated) need for action and
improvement has been identified (preferably through analysis of historical or projected performance
data).
Step 3: Quantify Objectives
7.17 The principle of “reliance on facts and data for decision-making” implies that objectives
should be specific, measurable, achievable, relevant and time-bound (SMART). The purpose of Step 3
in the process is to ensure that these aspects are properly addressed.
7.18 Step 3.1: Define how progress in achieving performance objectives will be measured and
which data are required. This section explains briefly that as part of the performance-based approach

Asia-Pacific Air Traffic Management Performance Measurement Framework V1.0
42
there is a need for defining: indicators; the metrics underpinning those indicators; and common
definitions for data aggregation and event classification. It also addresses the measurement granularity
and the need for harmonization. Current/past performance, expected future performance (estimated as
part of forecasting and performance modeling), as well as actual progress in achieving performance
objectives is quantitatively expressed by averages of indicators (sometimes called Key Performance
Indicators, or KPIs).
7.19 Indicators are not often directly measured. They are calculated from supporting metrics
according to clearly defined formulas, e.g. cost-per-flight-indicator = Sum(cost)/Sum(flights).
Performance measurement is therefore done through the collection of data for the supporting metrics
(e.g. leads to a requirement for cost data collection and flight data collection).
7.20 Indicators need to be defined carefully:
a) To be relevant, they need to correctly express the intention of the performance
objective. Since indicators support objectives, they should not be defined without
having a specific performance objective in mind.
b) They need to be expressed in terms of supporting metrics for which there is adequate
data availability.
7.21 When there is a problem with data availability, there are two possibilities:
a) Set up the appropriate data reporting flows and/or modeling activities, to ensure all
supporting metrics are populated with data as required to calculate the indicator(s)
associated with the objective;
b) If this is not possible, aim for a different kind of performance improvement, by
choosing a different performance objective, as constrained by data availability.
7.22 Note that the need for an indicator lasts only as long as the corresponding performance
objective exists. Alternatively, the need for supporting metrics (such as the number of flights) lasts
much longer because metrics are seldom indicator-specific, i.e. they are typically used to calculate a
variety of indicators. When deciding which data to collect, a sufficiently broad spectrum of supporting
metrics will have to be considered.
7.23 Data collection should take place at the most detailed level of granularity that can be
afforded because the availability of detailed data greatly increases the effectiveness of the
performance-based approach.
7.24 Common aggregation hierarchies and classification schemes (taxonomies) are then used
to condense the detailed supporting metrics into clearly scoped summary indicators.
7.25 To conclude: in a collaborative environment in which many stakeholders contribute to
the achievement of objectives and/or have performance reporting obligations, it is important to
harmonize not only the definition of indicators and supporting metrics, but also the scope definitions,
e.g. aggregation hierarchies and classification schemes (taxonomies).
Step 3.2: Define Desired Speed of Progress in Terms of Baseline and Target Performance
7.26 The above-mentioned performance indicators are the quantifiers for how well
performance objectives have been achieved. Performance targets are closely associated with
performance indicators: they represent the values of performance indicators that need to be reached or
exceeded to consider a performance objective as being fully achieved. Note that performance targets
can be set as a function of time (e.g. to plan yearly improvement); they can also vary by geographic
area, stakeholder, etc. In addition, targets can be set at different levels: local, regional or global.

Asia-Pacific Air Traffic Management Performance Measurement Framework V1.0
43
7.27 Once the scope of a target has been agreed, it becomes clear where and at which level
performance management will need to be applied, between which stakeholders the achievement of the
objective needs to be coordinated, and who will need to be involved in trade-off decisions. The term
target is used with different averages:
a) current versus future: when the aim of the objective is to improve current performance
over time, the term “target” refers to a future desired or required performance level;
b) real versus design specifications: when the aim of the objective is to manage real
performance so as to stay within pre-defined limits, the term “target” refers to design
specifications.
7.28 Performance targets may be set with different intentions, for example:
a) as a strategic design target, to support transition planning;
b) as a recommendation or incentive to promote the need for action and accelerate
improvements;
c) as a legal requirement;
d) as a performance level which needs to be achieved to enable other performance
improvements;
e) as a mandatory performance requirement which is necessary for safety reasons;
f) to gain access to certain airspace or receive certain levels of service.
7.29 To understand how challenging it is to reach a target, one should know the baseline
performance. The difference between the baseline and the target is called the performance gap. In a
“current versus future” application, the size of the gap is often expressed as a percentage of the
baseline performance (e.g. 10 per cent improvement needed to reach the target). For “real versus
design specifications” applications, targets are usually expressed as absolute values, without reference
to a baseline.
7.30 The determination of the baseline performance (calculation of baseline indicator values)
is done during the previous iteration of the process. It is one of the results of Step 6: Assess
achievement of objectives. This is part of the performance review.
7.31 The time available to achieve performance objectives is always limited. Therefore,
targets should always be time-bound.
7.32 The target and the time available to reach the target determine the required speed of
progress for the performance objective. Care should be taken to set targets so that the required speed
of progress is realistic. Target setting is used as a tool by managers, policymakers, regulatory bodies
and standardization organizations. Targets can have far reaching consequences depending on how
challenging they are and how serious they are taken.
7.33 In the air navigation system, appropriate decision-making/policymaking processes need
to be in place to collaboratively agree on performance objectives, performance indicators and the
values of performance targets at the local, regional and, where required, global levels.
Step 4: Select Solutions to Exploit Opportunities and Resolve Issues
7.34 The purpose of this step is to apply the principle of “informed decision-making, driven
by the desired/required results”.
7.35 It combines the knowledge of baseline performance, opportunities and issues with the
performance objectives and targets, in order to make decisions in terms of priorities, trade-offs,

Asia-Pacific Air Traffic Management Performance Measurement Framework V1.0
44
selection of solutions and resource allocation. The aim is to optimize the decisions to maximize the
achievement of the desired/required (performance) results.
Step 4.1: Select Decisive Factors to Reach the Target Performance
7.36 This part of the process is sometimes called performance gap analysis. As a result of Step
2, a qualitative inventory of present and future opportunities and issues that may require performance
management attention is already available. When analyzing blocking factors for runway capacity
improvement for example, it may turn out that for a given airport (example: single runway without
parallel taxiway), the dominant blocking factor is runway occupancy time, rather than wake vortex
separation minima. Knowing this, it is clear that solutions that reduce runway occupancy time will
contribute to runway capacity enhancement, whereas solutions which reduce wake vortex separation
minima will not contribute to the achievement of the objective in this particular example. Likewise, at
some airports the dominant constraining factor may be runway capacity, but elsewhere it may be gate
and apron capacity.
7.37 In order to make progress in reaching an objective, the dominant factors first need to be
undertaken. So the outcome of this activity is a selection and prioritization of opportunities and issues.
This can be seen as the development of a “performance strategy” for the achievement of a given
objective: working “backwards” from expectation related objectives, it cascades performance
requirements down to a selection of subordinate, enabling objectives and targets (e.g. to improve
airport capacity, to improve runway capacity, to reduce runway occupancy time) so the process:
a) eliminates/defers issues that do not immediately or significantly affect the
achievement of objective(s);
b) helps to maximize effectiveness if performance improvements have to be realized
with limited resources (e.g. budget, manpower);
c) creates a “traceability chain”, and/or a “performance case” which explains what will
be improved and how much, prior to the selection of solutions;
d) progresses the decision-making to the point where it is appropriate to start thinking
in terms of available solutions (options).
Step 4.2: Identify Solutions to Exploit Opportunities and Mitigate the Effects of the
Selected Drivers and Blocking Factors
7.38 At this stage, decision-makers need to know their options for mitigating pre-identified
issues and therefore to exploit available opportunities. This part of the process is about establishing
the list of options, i.e. defining the “solution space” which is at the disposal of decision-makers for
optimizing the achievement of performance objectives.
7.39 In the above example, for the objective “reducing runway occupancy time”, the list of
possible solutions/options may include: building extra taxiways to avoid the need for backtracking or
to eliminate the need for runway crossings; building high speed runway exits to give more options for
vacating the runway, thereby reducing runway occupancy time; and equipping aircraft with “brake-to-
vacate” technology, which enables pilots to select a runway exit while the aircraft is making its
landing approach. This increases the predictability of runway occupancy time, which in turn allows
reducing the separation minima on final approach. The latter will lead to increased capacity if runway
occupancy time is the dominating blocking factor. The list of solutions relates to the list of issues. In
this example, each solution addresses a different issue (which may or may not be present at a given
airport), but they all contribute to the same performance objective.
7.40 When the task is to improve the effectiveness of the day-to-day economic and
operational management, the list of options will most likely be populated with off-the-shelf solutions
and best practices, i.e. solutions which are readily available.

Asia-Pacific Air Traffic Management Performance Measurement Framework V1.0
45
7.41 When working with longer time horizons (during transition planning), a number of the
options or operational improvements may still be in their research, development and trials phases,
averaging that decision-makers will have to work with a “living” list of options, which are still
surrounded by a certain degree of uncertainty.
7.42 In any case, decision-makers need to gain a good understanding of the strategic fit, the
benefits, cost and feasibility of each option for operational improvement. Therefore, the description of
the operational improvements in the list needs to show that they have been developed from different
complementary perspectives. To produce this list of options, the performance-based approach should
be applied at each level.
7.43 In those cases where a list of options/operational improvements was already developed
during a previous planning cycle, the task consists of updating the list to take the latest developments
into account. In the case of transition planning-where the process may be executed only once every
five years-“updating the list” averages significantly “refining the list”.
Step 4.3: Select a Sufficient Set of Solutions
7.44 This is the part of the process where decisions are made based on which solution(s) to
implement. The following information is available to support decision-making:
a) definition of system/expectation scope and context;
b) the required results in terms of performance objectives and targets (in some cases, for
a certain date, in other cases, as an evolution through time, specifying a “required
speed of progress”, e.g. four percent improvement per year);
c) prioritized issues and opportunities, and their impact on performance; and
d) an overview of candidate solutions and their capability to resolve issues and exploit
opportunities, in terms of:
list of operational improvements;
associated enablers (services and procedures, human resources, systems and
technology, and regulation and standardization).
7.45 It is within this framework that decisions have to be taken. The nature of the decision and
the method best applied depend on the situation, as explained below. Assume an example in which
one has identified a number of candidate solutions to increase runway capacity. The requirement is to
exceed a certain capacity target while staying below a certain cost target. This is illustrated in Figure
4-2. For each candidate solution, the expected runway capacity and associated cost have been assessed
during the previous step. With this information, the various candidate solutions can be positioned in
the capacity/cost diagram of Figure 7.

Asia-Pacific Air Traffic Management Performance Measurement Framework V1.0
46
X 轴
A
B
D
C
E
F
Capicity
Current
performance
Target
performance
Figure 7: Expected performance of candidate solutions (example)
7.46 What is the decision to be taken and which method is to be used? Depending on which
subset of the solutions is available, the answer will vary. Your project may be faced with any
combination of the situations described in Table 6.
Case
Solutions
Decision
1
Only A, B, C, and F are available.
None of these solutions meets both
targets.
None of the proposed solutions is satisfactory. Decide
whether to:
— continue searching for solutions which address the
selected issues and opportunities and meet all targets;
— focus on different issues and opportunities (this
assumes that the objectives can be achieved using a
different method or by setting different priorities);
— relax the target(s) (which makes it easier to achieve
the objective(s), but the impact of this would need to
be assessed);
— abandon the performance objective(s) altogether
(this also requires an impact assessment).
2
D and E are under development
and not yet available when needed.
Decide what can be done to advance the availability date
of D and E. In many cases, availability constraints are
imposed by enabler deployment and this would imply a
need to accelerate the deployment of certain enablers.
3
Only D is available and/or meets
all targets.
There are no alternatives to choose from. Accept
solution D.
4
Only D and E are available. They
are mutually exclusive.
Both candidate solutions exceed the targets. Select the
“best buy”. Is it worth choosing E instead of D? A
commonly used method for making the decision is
multi-criteria decision analysis (MCDA).
5
Only D and E are available.
They can be applied
simultaneously.
D and E may be complementary in delivering
performance benefits (improving performance in
different places, at different times of the day, under

Asia-Pacific Air Traffic Management Performance Measurement Framework V1.0
47
different conditions). Decide whether to combine them
into one “implementation package”.
6
Only D and E are available.
It may make sense to first use solution D, and after a
while (some years) to replace D by E to achieve better
performance. Decide how to include D and E in the
“road map” or “deployment sequence”.
7
D is available, but its capacity will
suffer if solution G is also applied.
This is the case where D and G interfere with each other
from a performance perspective. Trade-off
considerations will need to be part of the decision
process. The aim is to take a balanced decision.
See Appendix A for more information about trade-offs.
Table 6: Selection of solutions (example)
7
Select
balanced
combination of
solutions using
trade-off
considerations
Outcome of
candidate
Solution
evaluation
Zero
options
One
option
Multiple
options
No suitable
solution
Solutions
not yet
mature
Mutually
exclusive
solutions
Solutions for
simultaneous
deployment
Solutions
not mutually
exclusive
Options
reinforce
performance
Options
have mixed
performance
impact
Solutions for
sequential
deployment
1
Try to find other
solutions or modify
performance
objectives / targets
2
Try to advance
availability date
of solutions
3
Accept
this solution
4
Select
“Best Buy”
(use multicriteria
decision
analysis)
5
Define
“Implementation
Packages”
and define
deployment
criteria
6
Define
deployment
sequence
Figure 8: Selection of solutions
7.47 Depending on the nature of the project, the output of this process step is either a single
preferred solution, or a road map of selected solutions (combined into implementation packages and
sequenced into a deployment sequence), accompanied by an initial performance case that describes
those issues which are resolved and opportunities exploited, together with the expected costs and
benefits in terms of performance improvement towards the specified targets.
Step 5: Implement Solutions
7.48 This step is the execution phase of the performance management process. This is where
the changes and improvements that were decided upon during the previous step are organized into
detailed plans, implemented, and begin delivering benefits. Depending on the nature and magnitude of
the change, this could average:

Asia-Pacific Air Traffic Management Performance Measurement Framework V1.0
48
a) in the case of small-scale changes or day-to-day management:
Assigning management responsibility for the implementation to an individual;
Assigning responsibility and accountability for reaching a performance target to
an individual or organization; and
b) in the case of major or multi-year changes:
Refining the road map of selected solutions into a detailed implementation plan,
followed by the launching of implementation projects.
Ensure that each individual implementation project is operated in accordance
with the performance-based approach. This averages launching and executing
the performance management process at the level of individual projects. Each
project derives its scope, context and expectations (see Step 1 of the process)
from the overall implementation plan.
Step 6: Assess Achievement of Objectives
7.49 The purpose of Step 6 is to continuously keep track of performance and monitor whether
performance gaps are being closed as planned and expected. This implies data collection to populate
the supporting metrics with the data needed to calculate the performance indicators. The indicators are
then compared with the targets defined during Step 3 to draw conclusions on the speed of progress in
achieving the objectives. This step includes monitoring progress of the implementation projects,
particularly in those cases where the implementation of solutions takes several years (as in the
example), as well as checking periodically whether all assumptions are still valid and the planned
performance of the solutions is still meeting the (perhaps changed) requirements.
7.50 With regard to the review of actually achieved performance, the output of Step 6 is
simply an updated list of performance gaps and their causes. In practice, the scope of the activity is
often interpreted as being much wider and includes recommendations to mitigate the gaps. This is
then called performance monitoring and review, which in addition to Step 6 includes Steps 1, 2 and 3
of the performance management process.
7.51 For the purpose of organizing performance monitoring and review, the task can be
broken down into five separate activities:
a) Data collection;
b) Data publication;
c) Data analysis;
d) Formulation of conclusions;
e) Formulation of recommendations.
Data collection
There are essentially two major categories of data feeds that performance monitoring and review will
deal with:
a) data which are captured by automatic averages and forwarded in electronic form with
little or no human intervention. This type of data feed is typical for high volume
streaming measurement data and automated database-to-database exchanges;
b) manual reporting of information (electronically or on paper). This requires human
effort to collect, interpret, analyze, structure and otherwise prepare the data for
reporting. Typical for low-frequency, complex information data feeds in which the
performance monitoring organization receives processed information (forms, reports)

Asia-Pacific Air Traffic Management Performance Measurement Framework V1.0
49
instead of raw data feeds.
7.52 To establish data feeds in each KPA, the following steps need to be undertaken:
a) identify information needs;
b) identify potential suppliers of data;
c) ensure information disclosure by candidate data suppliers;
d) manage the data feeds on an ongoing basis.
Data access and publication
7.53 The performance review can begin once the required data (performance targets and
current/anticipated values for performance indicators) are available. The first activity in this process is
data publication. With proper ATM community participation in place, ATM performance will be
evaluated by two different groups: performance specialists (e.g. analysts from designated ATM
performance review organizations); and people with a generally high level of interest in ATM
performance. Each group has its own specific need for access to ATM performance data, which
should be satisfied by appropriate data access and publication averages.
7.54 People with a general interest in ATM performance will wish to see executive level,
quality-controlled data and draw their own conclusions, at which point, the need arises to make
certain performance data publicly available in the interest of transparency. A capability is therefore
required which enables them to monitor the current situation against the performance targets, and to
provide them with the general trends, the “big picture” and their own performance in comparison with
others. This need can be satisfied by publishing high-level performance indicator indices. These
indices are periodically updated and generally allow limited or no interactivity by the user.
7.55 In addition, analysts from designated ATM performance review organizations are tasked
with gaining an in-depth understanding of ATM performance and finding causes and effects. Their
work is an integral part of the performance management process described earlier. Their data needs
can be satisfied by publishing selected data in performance assessment databases which are designed
to suit the analysts’ needs. These databases should allow high levels of interactivity (querying and
analysis).
Data analysis
7.56 At the data analysis stage, the performance review organization should ensure that the
data are already quality-checked. Rather than struggling with data quality issues, analysts should be
able to focus on their main task: performance review. Analysts need to examine the reasons for
(good/poor) performance, and explain these to decision-makers, while gaining a better insight into
past, current and future ATM performances. To that effect, analysts will compare performance
indicators against performance targets, identify performance evolution trends, analyze historical
evolution of performance, and find relationships (correlations) between performance indicators,
supporting metrics, etc.
7.57 They will look at the “big picture” (annual totals and averages, performance indicators
summarized during the planning cycle) and break down the data into very detailed levels to find the
causes of performance gaps and the reasons for trade-offs. Analysts will also make use of various
modeling techniques to increase their understanding of system performance. As a side effect of data
analysis, analysts will be able to propose performance objectives, define new performance indicators
and identify data needs.
Formulation of conclusions

Asia-Pacific Air Traffic Management Performance Measurement Framework V1.0
50
7.58 After completing the data analysis, analysts are expected to document the conclusions for
each KPA. Normally, these conclusions contain an assessment of the current and expected future
performance for each performance objective. Typically, the conclusions are published in a
performance review report.
Formulation of recommendations
7.59 An integral part of the performance review process is the formulation of
recommendations. These should be derived from the conclusions and also be included in the
performance review report. Recommendations should focus on how to meet ATM community
expectations through agreed upon performance objectives, performance indicators and performance
targets. When an evaluation indicates inconsistency between ATM community expectations and
performance objectives, performance indicators and performance targets, recommendations may
include: the need to set or change performance objectives; the need to (re-)define performance
indicators; the need to set or change performance targets.
7.60 Recommendations will typically fall into the following categories (non-exhaustive list):
a) the need to improve performance data collection;
b) suggested initiatives aimed at closing identified performance gaps;
c) suggestions to accelerate or delay performance improvements based on anticipated
evolution of traffic demand and predicted performance indicator trends;
d) setting up task forces, defining action plans, etc., with a view to beginning the
implementation process.
Positioning of performance review within the overall process
7.61 It is recommended that the performance monitoring and review activity is sufficiently
integrated into the overall performance planning process to ensure that the conclusions and
recommendations serve as direct input for Step 4 of the process, while simultaneously maintaining a
degree of independence from the other parts of the process in order to ensure a sufficient level of
objectivity and impartiality.
Repeat the process
7.62 Performance management is a closed loop process. The performance management
process is intended to be a closed-loop process. Step 6 has identified deficiencies, i.e. cases where
performance is not as expected, despite the implementation of changes designed to achieve
performance improvements. These deficiencies are to be acted upon by starting the next iteration of
the process.
7.63 One may be surprised to note that this implies revisiting Step 1: Define/review scope,
context and general ambitions/expectations. It is strongly recommended not to skip this because the
performance management scope, context and general expectations may be subject to continuous
change.
7.64 The periodicity of the process greatly depends on where in the air navigation system and
lifecycle it is applied. Depending on the nature of your project/activity you could be responsible for
any of the following:
a) ensuring performance of concepts and systems:
during concept validation;
during and/or after implementation.

Asia-Pacific Air Traffic Management Performance Measurement Framework V1.0
51
b) application of regulatory methods to organizations, people and systems:
legal requirements, rules and regulations;
certification and licensing;
inspection and oversight.
c) annual performance review:
performance is evaluated in annual cycles, in a reactive way;
followed by actions in subsequent years to correct performance deficiencies.
d) proactive, collaborative performance planning:
medium-term planning processes (annual cycles);
strategic planning/seasonal scheduling (seasonal cycles); and
pre-tactical planning (e.g. daily cycles).
------------------------

Asia-Pacific Air Traffic Management Performance Measurement Framework V1.0
52
Appendix A: ICAO and GANP Performance Indicators Frameworks
Key Performance
Area
ICAO Key Performance Indicators
Access and Equity
Unsatisfied demand versus overall demand
Capacity
Number of flights or flight hours that may be accommodated.
Separate measures for airspace and airport either through models or
though actual values.
Values may be specific for a weather condition.
Cost Effectiveness
Average cost per flight at a system-wide annual level.
Total operating cost plus cost of capital divided by IFR flights.
Total labour obligations to deliver one forecast IFR flight in the system,
measured monthly and year-to-date.
Efficiency
Percentage of flights departing on-time.
Percentage of flights with on-time arrival.
Average departure delay per delayed flight
Percentage of flights with normal flight duration.
Average flight duration extension of flights with extended flight
duration.
Total number of minutes to actual gate arrival time exceeding planned
arrival time.
For all of the above consider 1) ATM caused delay, 2) target time for
delay (filed or schedule) and 3) delay threshold value (i.e. 15 minutes)
Environment
Amount of emissions attributable to ATM inefficiency
Number of people exposed to significant noise
Fuel efficiency per revenue plane-mile
Flexibility
Number of rejected changes to the number of proposed changes to the
number of flight plans initially filed each year
Proportion of rejected changes for which an alternative was offered and
taken.
Global
Interoperability
Number of filed differences with ICAO Standards and Recommended
Practices.
Level of compliance of ATM operations with ICAO CNS/ATM plans
and global
Interoperability requirements.
Participation by
ATM Community
Number of yearly meetings covering planning, implementation and
operations.
Predictability
Closely related to delay measures under efficiency
Possible refinement to delay measures by phase of flight.
Safety
Number of accidents normalized to either number of operations or
number of flight hours
Security
Number of acts of unlawful interference to ATC
Number of incidents involving direct unlawful interference to aircraft
that require air traffic service provider response
Number of incidents due to unintentional factors such as human error,
natural disasters, etc., that have led to unacceptable reduction in air
navigation system capacity
Table 1 Key Performance Area

Asia-Pacific Air Traffic Management Performance Measurement Framework V1.0
53
Key Performance
Area
GANP Key Performance Indicators
Capacity
Airport peak arrival capacity.
Efficiency
Additional taxi-in time.
Additional taxi-out time.
Airport arrival throughput.
Predictability
Flight arrival punctuality.
Flight departure punctuality.
Flight time deviation.
Cost Efficiency
Airport arrival throughput.
Table 2 Core Indicators in GANP

Asia-Pacific Air Traffic Management Performance Measurement Framework V1.0
54
Appendix 2: Filed Flight Plan En-Route Extension Rate/Actual En-Route Extension Rate
Those indicators of filed flight plan en-route extension and actual en-route extension are defined by
previous studies (E.g. Kettunen, et al. 2005; Boeing & CANSO, 2012; Eurocontrol & FAA, 2012).
Trajectory based performance evaluation is mostly used to estimate the operational performance of
efficiency and influence of environment due to the inefficiency operation.
Eurocontrol has further utilized the air route extension rate to estimate the level flight efficiency in
PRR. In the main body of this report, two KPIs of air route extension rate are selected, which are
respectively effected by terminal and en-route condition. As is shown in the picture below: (A) is the
actual flight trajectory of s flight, (D) is the great circle between the departure airport area fix and the
arrival airport area fix and (H) is the projection of (A) or (D) on the connection between two airports.
Thus the calculation function:
Air route extension rate (affected by route condition) = ((A) – (D))/ (D)
Air route extension rate(affected by terminal condition)= ((D) – (H))/ (H)
Departure
airport area
Arrival
airport area
A
B
C
D
(A)
(
H
)
(
D
)
Filed flight plan en-route extension, compares the length of the en-route section of the last filed flight
plan with the corresponding great circle distance. Similarly, actual en-route extension compares the
length of the en-route section of the actual trajectory with the corresponding achieved distance. The
indicator is calculated as the ratio of the two sums (length of trajectories and achieved distances), over
all flights considered.
Filed flight plan en-route extension compares the filed flight plan to the great circle. While the filed,
flight plan is the ultimate output of the planning process, this indicator would be possible to measure
the inefficiency at intermediate stages by considering the shortest possible route on the route network
and the shortest available route for the specific flight. The shortest possible route is constrained by the
design of the route network. Historically, the route network was structured in reference to aircraft
navigational limitations and to enable air traffic control to provide separation with the tools available.
As performance of both aircraft and ATC has improved, the need for such a rigid en-route structure
has diminished, to the extent that free route airspace would now be possible throughout the entire
area. This would have positive effects both on the Filed flight plan en-route extension and the actual
en-route extension.
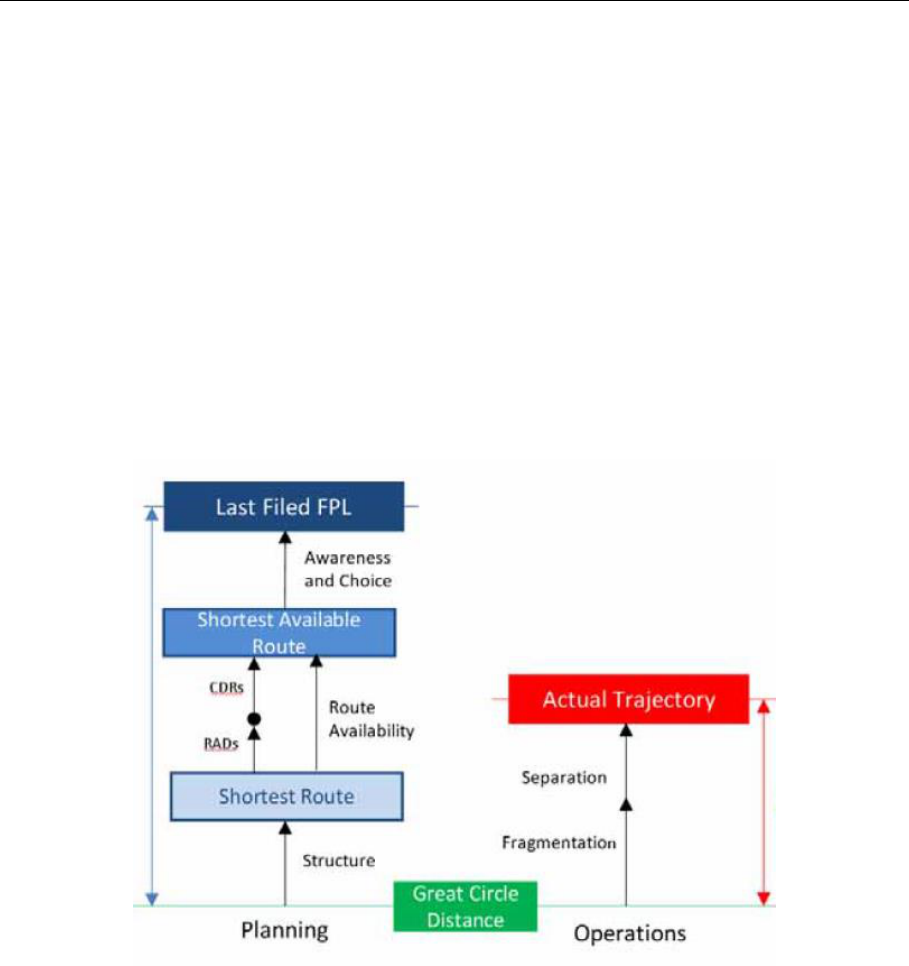
Asia-Pacific Air Traffic Management Performance Measurement Framework V1.0
55
The shortest available route is specific to a flight and takes into account the additional constraints
introduced by the Route Availability Document (RAD) and Conditional Routes (CDRs). The RAD
has the effect of modifying the route network available to specific flows of traffic, while CDRs have
the effect of modifying the route network available at specific times. Both of these reduce the set of
available routes. Differences between the shortest available route and the route in the filed flight plan
can arise because the airspace user might not be aware that the route is available, or just choose an
alternative route for operational or business reasons.
The actual en-route extension, on the other hand, reflects the actual environmental performance. In
this case a distinction can be made between two separate components: “separation” and
“fragmentation”. “Separation” relates to the need to safely manage the flow of traffic and has to be
considered as a hard constraint. It is important to bear in mind that the level of inefficiencies cannot
be reduced to zero. “Fragmentation” refers to operational inefficiencies created by non -homogenous
processes and systems and airspace and sector design due to non-operational factors.
It is recognized that actual en-route extension can be a representation for fuel efficiency as the most
fuel efficient route depends on wind. However, the wind optimal route might not necessarily
correspond to the choice of the airspace users because they might use different measures, such as total
cost (which would be dependent on the airspace users).

Asia-Pacific Air Traffic Management Performance Measurement Framework V1.0
56
Appendix 3: Abbreviations
AAR
Airport Acceptance Rates
ADS-B
Automatic Dependent Surveillance - Broadcast
AIBT
Actual in-block time
ALDT
Actual landing time
ANSP
Air navigation service provider
AOBT
Actual off-block time
ATC
Air traffic control
ATCOs
Air Traffic Control Officers
ATFM
Air traffic flow management
ATM
Air traffic management
ATOT
Actual take-off time
ELDT
Estimated landing time
ETOT
Estimated take-off time
KPI
Key Performance Indicator
ICAO
International Civil Aviation Organization
STA
Scheduled time of arrival
STD
Scheduled time of departure
TMA
Terminal area
